Operational Amplifiers and Signal Conditioning
Objective
By the end of the laboratory the student will:
- Use an op-amp as a high input-impedance buffer and a low output-impedance buffer.
- Use op-amps circuits to condition the signals from transducers for input to a DAQ.
- Create a filter with an op-amp to separate a wanted from an unwanted signal.
Before You Begin
This lab will be done in sub-teams of two or three. Plan your time and workload accordingly. Bring your protoboard!
The instructions for this lab are not as detailed as for some of the earlier labs. You are expected to plan out your experiments and fill in the blanks. Ask a proctor or professor for help if you can't figure out what to do. If they don't know, call my cell and ask me.
Reminders:
- Bring your protoboards with you to lab.
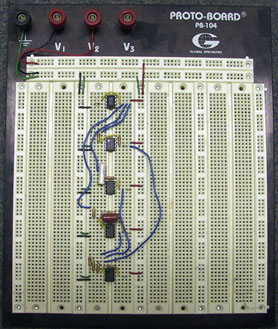
- Neatly laid out protoboards work better. Seriously, they do. They're easier to troubleshoot as well. Seriously, they are! Please take the time to do it right. See the above picture.
- Keep your leads short and close to the board.
- Strip off the minimum amount of insulation to let your patch wire work; Don't have big bare areas that can touch other things and short.
- Trim your resistors and capacitors to keep the components close to the boards. Don't leave the leads long. Get the components down by the board.
- Use the long busses for power only. Do use them for power and ground. Don't use them for signals. Use bypass capacitors (see below) on your power busses.
- To the extent possible use coaxial cables to get signals on and off of your board. Put the input signals onto the board as close to the circuit inputs as possible. For example, use a coaxial cable with BNC connectors from the signal generator and then put spring-loaded mini-clips on the other end. Connect the mini clips to your circuit input and ground.
- If your are using dual supplies for your op-amps, have three power busses: V+ connected to the +20V output on your power supply, V– connected to the –20V output on your power supply, and GND connected to the COM output on the power supply. You can adjust your supply voltage to be anything from ±1V to ±15V depending on what chips you are using.
- If your are using a single supply for your op-amps, have two power busses: V+ connected to the +20V output on your power supply, and GND connected to the COM output on the power supply. You can adjust your supply voltage to be anything from +1V to +15V depending on what chips you are using.
- Color code your wiring. A common practice is to use red for V+ power, black for V– power, green for ground, and white or blue for signal lines. If you have a rat's nest of all red wires, neither the professors, nor the proctors (nor you for that matter) will be able to figure out what goes where.
It wouldn't hurt to take a look at Auntie Spark's Guide to Op-Amp Circuits.
In standard practice, op-amps are shown in schematics without the power connections. However, you must supply power to the power pins or the op-amps won't work! For reference, the circuit below shows the power connected to the op-amp.
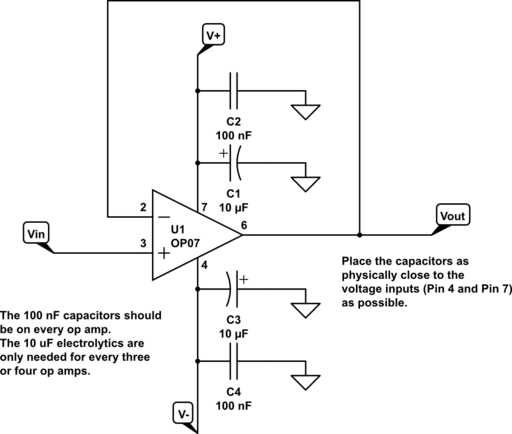
Because operational amplifiers have such high gain, if the power busses are long, the op-amps may interact with the busses and cause oscillations. The circuit works one day and is filled with noise the next. You can almost totally eliminate this issue by placing bypass capacitors between the power supply pins and ground as close as physically possible to each op-amp. Standard practice recommends both a 10 µF electrolytic capacitor and a 0.1 µF standard capacitor. For E80 just the 0.1 µF standard capacitor will suffice. If you use the electrolytic capacitors, remember that they are polar and if you put them in backwards they won't work. For dual supplies the capacitors run between V+ and ground, and V– and ground. For single-sided supplies, they run between V+ and ground. The circuit below shows a unity-gain buffer amp with dual power supplies and bypass capacitors.
Section 1 – Signal Conditioner
Measurement Specialties Inc. manufactures piezoelectric dynamic strain gauges. They differ from traditional strain gauges in three respects:
- Their output is 1000 time larger, e.g., volts instead of millivolts.
- They cannot measure DC strain.
- They are 10-to-20 times cheaper.
They are very useful for measuring vibration. The cantilever vibration tester has four MSI FDT1-028K sensors attached. You need to create an op-amp circuit to condition the output of the sensors. Before designing the circuit, connect the output of one of the sensors to an oscilloscope and measure the output when you tap the cantilever (never tap directly on the sensor or leads, only on bare metal). What is the magnitude? What are the characteristics of the waveform? Adjusting the oscilloscope trigger may help in capturing a transient.
MSI recommends one of two circuits for conditioning the signal, either a charge amplifier, or a voltage amplifier. Read the circuit recommendation sheet and design a circuit to condition the output signal for a myDAQ. Connect the output to the myDAQ and examine the output signal in both the frequency and the time domain. The VI, CantileverProcess.vi may help. You may need to change the physical channel in the DAQAssistant subVI to the actual channel of your myDAQ.
The cantilever was designed to have natural frequencies at 223 Hz, 1399 Hz, 3918 Hz, 7677 Hz, 12691 Hz, and 18958 Hz. Details of natural frequency calculations can be found here. Where you tap the cantilever affects the relative magnitudes of the different modes. How many of the natural frequencies can you excite and observe? How close are they to the design frequencies? Are there any extraneous signals? What are most likely causing these? Does tapping on the apparatus somewhere other than on the cantilever affect the observed frequencies or magnitudes?
Section 2 – Frequency Filter
You will start with the signal conditioning circuit you used in the previous section. Often in an experiment you have a signal that you want at one frequency or range of frequencies and a signal that you don't want at a different frequency or range of frequencies.For this experiment you want to observe the fundamental frequency of the cantilever, but you want to filter out the higher harmonics.
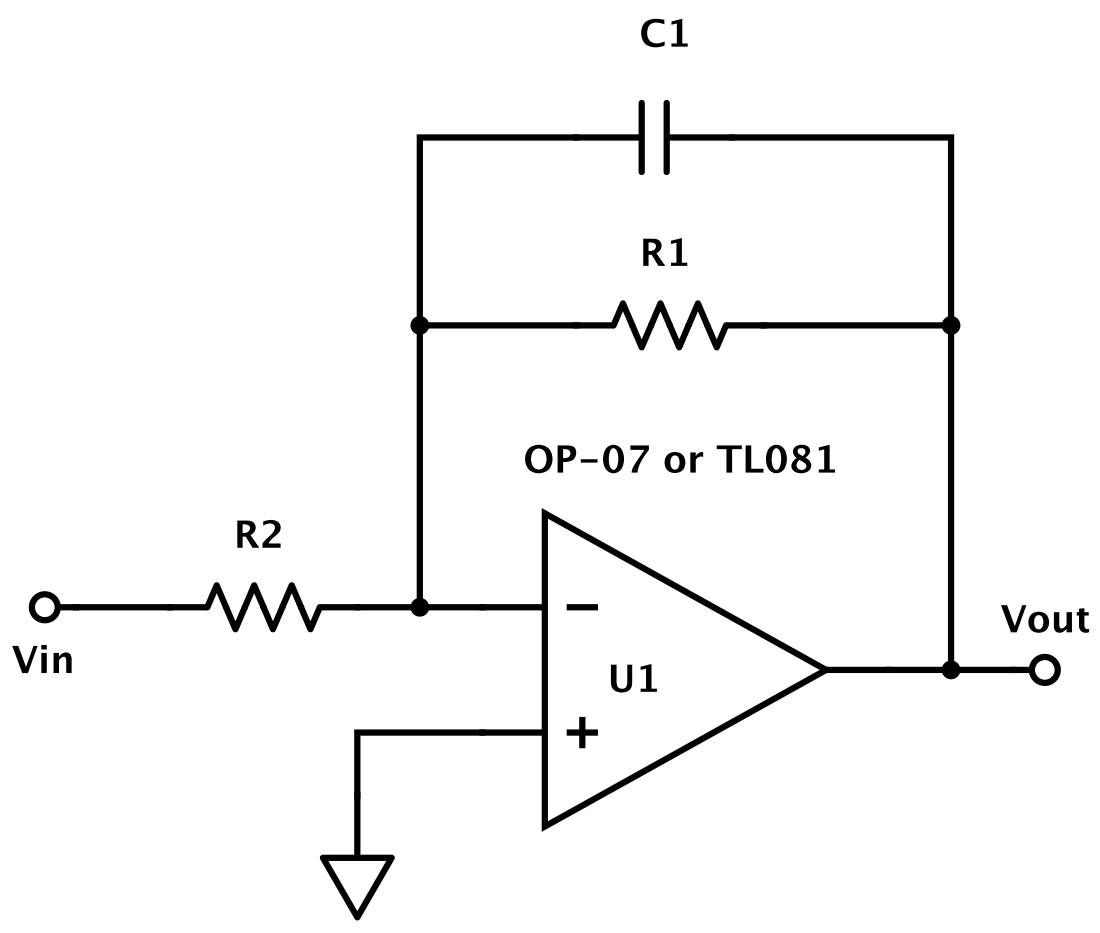
Build the circuit shown below. What is the calculated frequency response of the circuit (look up first-order lowpass filter if you're having challenges)? Choose values for R and C so that 1/RC is at a frequency between the fundamental (f0) and the first harmonic (f1) , but closer to the fundamental. Don't forget about 2π. Choose a C of around 1 µF to 10 nF. Build the circuit with the components you specified. Connect it to the output of the signal conditioning circuit and observe the response in both the time and frequency domains when you tap the cantilver. Do the amplitudes of the higher harmonics seem reduced relative to the fundamental? Can you think of a use for this circuit? Does it work as well as you would like?
Section 3 – Sallen & Key Filter
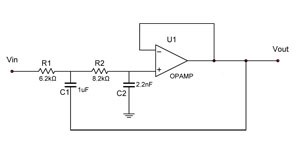
A simple first-order lowpass filter is not a very effective filter. The cutoff is quite gentile. The minimum that is used in practice is a second-order filter and fourth-order or higher are not uncommon. The most common implementation is the Sallen-Key topology. Each section of the filter provides two additional poles. A second-order lowpass Sallen Key filter is shown below. The design equationsfor a Sallen Key filter can be found here. The values of Q for Butterworth filters for orders from 2 to 10 can be found on page 8.42 of this report.
Implement a Butterworth filter of at least second order, and report on its effect on the vibration signal from the cantilever. Using a myDAQ create a Bode plot of the filter response.
For Future Reference: Lowpass filters are often used for antialiasing filters on data acquisition system. This spreadsheet will calculate the corner frequency of a Butterworth filter given the order, the sample rate, and the desired attenuation at the Nyquist frequency.
Section 4 – Pressure Transducer
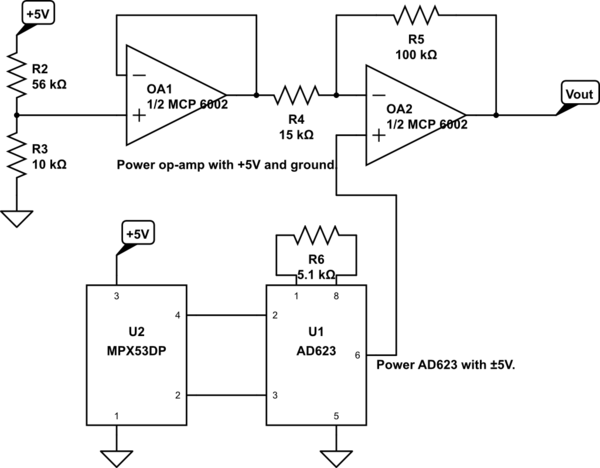
Read the data sheet on the pressure transducer with two ports, the MPX53DP. The output voltage of the transducer is the difference between the V+out and the V–out ports. Neither port should be tied directly to ground. Often some sort of differential or instrumentation amplifier is useful (see Section 3 of the Temperature lab). Either design a circuit or use the one below to power the pressure transducer and scale the output into a range suitable for the DAQ such as 0V-to-3.3V or ±5V. If you use the one below, you can increase the gain on the AD623, or add another non-inverting apmlifier on the output if you signal range is too small. You can also replace the 56 kΩ — 10 kΩ voltage divider with a 50 kΩ trim pot if you want to adjust the DC offset. Build the circuit and a VI to read and display the pressure. Test the VI and circuit by cutting a small length of tubing and putting it on the positive pressure port and gently blowing into the tube. When you've finished testing, remove the tube and throw it away. If you use the circuit below, be sure to describe what it does and calculate the gains and offsets in the different stages.
One of the possible uses for a pressure sensor is for a depth sensor in water or an altitude sensor in a rocket. If such a thing is not currently at your lab station, cut a 60 inch length of tubing and attach it with electrical tape to a yardstick so that an open end is at one end of the yard stick and the tube runs straight up and off of the yardstick. Attach the other end to one of the ports on the pressure sensor. Fill a graduated cylinder with water to within about 1 1/2 inches of the top. Place your sensor and circuit at a level higher than the top of the water and generate a plot of pressure sensor output versus water depth. Is the plot close to linear as expected? How close is the slope of the plot to the expected slope? The pressure of a given height of a column of fluid is ρgh, where ρ is the density in kg/m3 (1000 kg/m3 for water at 4°C), g is the standard acceleration of gravity (actually the local, but standard is close enough), and h is the height of the water column in m. The pressure comes out in N/m2 or Pa. Be sure not to get any water into the pressure sensor. Remove the tube from the sensor when finished.
Extra Credit – Pressure Transducer
We also have another pressure sensor, the MPXA6115AC7U. It can be used as an altitude sensor. Design a circuit to power the pressure transducer and scale the output into a range suitable for the DAQ such as 0V-to-3.3V or ±5V. Build the circuit and a VI to read and display the pressure. Test the VI and circuit by cutting a small length of the appropriate tubing and putting it on the port and gently sucking on the tube. When you've finished testing, remove the tube and throw it away.
The standard model for the atmosphere is referenced here. You only need to use the portion of the model that is valid between 0 and 11 km. With the aid of the hand vacuum pump and the high-accuracy pressure sensor, calibrate your sensor and develop a VI to calculate the altitude from the reported voltage. More information is available at this old page.
Extra Credit – Nonlinear Voltage Divider
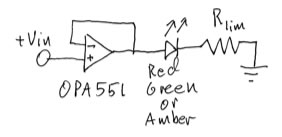
Using the LED driving reference circuit below, measure and plot the voltage at the LED Rlim junction as a function of Vin from a Vin of -DesignVoltage to +DesignVoltage where DesignVoltage is the maximum voltage for which you designed your LED driving circuit. Why is the line not straight? Can you think of a use for this circuit?
Reference Circuit – Transimpedance Amplifiers
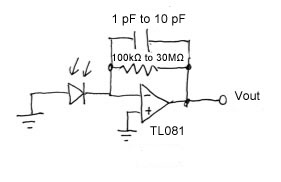
This circuit is not part of the current lab, but it is very useful if you want to use a photodiode to measure light intensity. Photodiodes are precision devices for measuring the intensity of a light source. While calibrating a photodiode to measure absolute levels of light intensity is a challeng, a simple circuit will measure relative changes to 16-bit accuracy. The circuit connects a BPW46 PIN photodiode to an op-amp in the following topology. The circuit transforms the current from the photodiode to an output voltage. Derive the equation for the gain of the circuit (ignoring the capacitor). What are its units? Why is it called a transimpedance amplifier? What value of feedback resistor should you use? Can you use the data sheet to help you decide? Does the Light Current versus Irradiance plot help? Can you use empiricism when all else fails? If the circuit is noisy or unstable, sometimes you can put a small capacitor (1pF to 10pF in the figure) in parallel with the resistor as shown.
Check the output of the transimpedance amplifier on the scope. Is it working properly? How would you know?
Build a VI to read the output of the transimpedance amplifier. Include both a graphical display and a while loop so it will run continuously until you hit the Stop button (not the Abort button). You are basically making an oscilloscope VI. Run the VI and cover the photodiode with a dark object. Can you see the change in intensity? If you want you can compare your VI with the results from the NI ELVISmx Scope.
Reference Circuit – An LED driver
This circuit is not part of the current lab, but it is very useful if you want to drive an LED. A Light Emitting Diode (LED) coverts current into light. It exhibits the same V-I charaistics as a normal diode. Once the current reaches a certain threshold value the LED will glow. Above the rated current the LED will glow brightly and then fail. The circuit below will power an LED from one of the analog outputs of the myDAQ. It is a unity-gain buffer. FOr the max value of input voltage, you need to calculate the required current-limiting resistor for your chosen LED. You can calculate the necessary resistors using this link. Assume the current limit is 20 mA. We have a supply of LEDs that have been sitting around for years (probably more than 10) so we don't have spec sheets for them and we won't get upset if they get destroyed by driving them with currents above 20 mA. 40 mA is probably safe for short periods. An average of 20 mA is also fine, e.g., a pulse train that is 60 mA on and 0 mA off with a duty cycle of 1/3.If you use an Op-07 instead of the OPA551 you are limited to 20 mA.
Try driving your circuit with a 1 Hz sine wave using the myDAQ FGEN function generator. Does the LED blink on and off? Experiment with the frequency and see if you can determine the point when you can no longer see the blinking, but the LED seems constantly on. Try the experiment with the LED at the edge of your vision. Is the frequency higher or lower? Our eyes perceive motion more easily at the edge of our vision than they do at the center. We see more spatial detail at the center. Does motion response correspond with frequency response? You can read more about it here if you are interested.
Build a second circuit with a different color of LED. Position the photodiode from the previous section so that it can see both LEDs. Drive one of the LEDs with a sine wave and observe it with the photodiode circuit. Does the output look sinusoidal? Why or why not? Does the shape change with the amplitude and offset of the driving waveform? Try driving the LED with other waveform shapes. What is happening in the LED-photodiode pair? Can you think of a use for such a circuit, i.e., one where you input a signal to the LED and use the output signal from the photodiode?
Try driving both LEDs at two different frequencies, such as 123 HZ and 251 Hz. You can use either another myDAQ or the physical function generator. Can you see both waveforms?