Drag and Velocity Measurements
Objective
By the end of the laboratory the student will:
- Demonstrate the safe start-up and shut-down sequence for the wind tunnel.
- Set and verify the wind speed in the wind tunnel.
- Compare measured drag forces on standard shapes in a flow field with literature values.
- Model and Measure the drag and lift forces on the rocket in various orientations in a flow field.
- Calibrate the Pitot sensor in the rocket nose cone.
Section 1 – Wind Tunnel Instrumentation
The instructions for this lab are not as detailed as for some of the earlier labs. You are expected to plan out your experiments and fill in the blanks. Ask a proctor or professor for help if you can't figure out what to do.
Some hints:
- Fixtures have lift and drag on their own.
- When you weigh something you use the tare button to cancel out the weight of the container. Why is that?
- When recording an unsteady measurement you can estimate both the average and the variance or standard deviation.
- What are the correct cross-sectional area and characteristic length? Are you sure?
- Put everything back where it goes (not necessarily where you found it).
- Don't touch the knobs on LVDTs. Ask a professor or proctor to calibrate it for you if you need.
Pitot Probe Airspeed Measurement
- Observe the mounting of the pitot probe in the tunnel. Ensure that the end
of the tube is properly oriented directly facing the incoming airflow.
Connect the pitot probe to the digital manometer.
- Familiarize yourself with the pitot probe air velocity calculation card*. As
practice, use the card to predict the velocity at readings of 0.06, 1.2, and
7.0 inches of H2O at the current conditions in the lab. Verify your results
by computing the velocities directly. You may double check your direct calculations with this spreadsheet, but you must show your work. Until we better instrument the wind tunnel, you will have to estimate the temperature and relative humidity of the air in the wind tunnel. Using the condition of th eair in the room is a good staring point. If it is working, there is a display on the table for the current room conditions.
- Power up the wind tunnel and measure the airspeed at increments of RPM. You adjust the speed with the knob on the pillar (which they put on in the wrong position when they reassembled the wind tunnel) near the observation box. You read the RPM in the white box near the main power switch. Allow time at each measurement for the wind tunnel to come to steady state. Repeat measurements with increasing and decreasing RPM to ensure reproducibility. Plot a calibration curve of airspeed in the test section versus RPM. Perform the necessary regression analysis and display the appropriate error bars.
*Instructions for the card can be found in the middle of this page:
http://www.dwyer-inst.com/ApplicationGuides/?ID=16. Search for "To use the Dwyer Calculator:" on the page. Here is an image of the card:
http://www.amazonsupply.com/dwyer-velocity-calculator-slide-chart/dp/B009P8HT20. There is also a free app version: http://www.dwyer-inst.com/HVACCalculatorApp/.
Section 2 – Standard Shapes
- Measure the drag force on the two different diameter spheres at increments of fan rotation speed. Plot the drag force versus airspeed in the test section. Display the appropriate error bars. Plot the coefficient of drag versus Reynolds number for the two spheres with logarithmic axis scaling. How close are the plots for the two spheres?
- Compare your measured drag coefficients for the standard shapes to literature
values. Discuss any discrepancies you may find.
Extra Credit
If you have time after finishing the rest of the lab, repeat parts a and b for two different diameter cylinders in cross-flow (the axis of the cylinder normal to the air flow).
Section 3 – The Rocket
- Choose either the Phobos or X-Calibur scale rocket model and annotate which you chose. Measure the drag on the scale rocket model with the rocket axis parallel to the airflow for a series of airspeeds up to 60 mph (you can go higher if the rocket isn't oscillating or vibrating) and plot the
coefficient of drag versus Re.
- Compare your measured drag coefficients for the rocket to those found using the
simulator RockSim or OpenRocket on the laptop. Use the rocket file corresponding to your particular rocket, either the PML Phobos or PML X-Calibur. The PML Phobos and X-Calibur files are phobos_38mm_hamr_hmc.rkt and x-calibur_hamr_hmc.rkt for RockSim and phobos_38mm_hamr_hmc.ork and x-calibur_hamr_hmc.ork for OpenRocket. Check under Rocket->CD Analysis for RockSim or plot the Drag Coefficient under Plot/export -> Plot Data in OpenRocket. Discuss any discrepancies you may find.
- Measure the drag and lift on the scale rocket model as a function of angle of attack from 0° to 10° for a series of airspeeds and plot the
coefficients of drag and lift versus angle of attack with Re as a parameter. Note that the LVDTs measure the forces normal and parallel to the wind direction, and the lift and drag forces (on a rocket, not an airfoil) are normal and parallel to the rocket direction.
Section 4 – The Rocket Pitot Tube
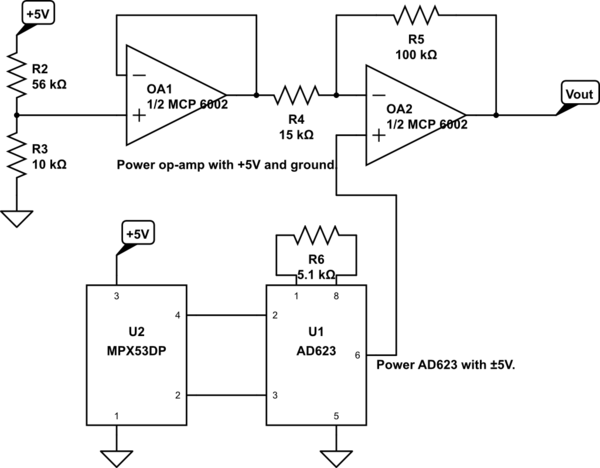
There is a rocket nose cone and payload section of a medium rocket which contains a Pitot and a static port. Flexible tubes can be connected to the two ports to exit from the back of the payload section. Using either the circuit you built in the OpAmp Lab or the circuit below calibrate one of the the MPX53DP sensors as a velocity sensor. You can increase the gain on the AD623, or add another non-inverting amplifier on the output if you signal range is too small. You can also replace the 56 kΩ — 10 kΩ voltage divider with a 50 kΩ trim pot if you want to adjust the DC offset. Gather the data using a myDAQ. You can either run the two pressure tubes outside the wind tunnel chamber or place the circuitry inside and run the electrical connections outside the wind tunnel chamber.
- Measure the output from the Pitot tube sensor for a series of airspeeds.
- Plot and fit the data. Do the data follow the expected theoretical curve? Explain any discrepancies.
- Develop a calibration expression to be used when analyzing the Pitot tube data from a rocket flight.
Check with a professor or proctor if you have questions on how to proceed.
Section 5 – Design Problem
Develop an analytical model for the impact velocity of the rocket described below as a function of the initial height above ground at which it commences the fall (apogee height). Use your model to create a plot of the impact velocity versus apogee height with apogee heights over the range 10 to 500m.
- Rocket mass = 964g
- Rocket body diameter for calculation of projected area = 4.19 cm
- Average CD = 0.57
- Average air density = 1.15 kg/m3
- Average air viscosity = 1.8e-5 kg/m/s
Discuss the validity of the assumption of constant drag coefficient over the range of apogee heights.
You may find the following integral helpful: 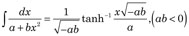
You may also find this link helpful.
Submit a second plot with a parachute deployed, diameter 1 m, average CD = 1.3
Appendix – Operating the Wind Tunnel
The wind tunnel operation is fairly straightforward but there are a few steps that must be followed:
- Make certain the plexiglass window is in place and held by the four clamps before starting the wind tunnel and make sure the wind tunnel is stopped before removing the window.
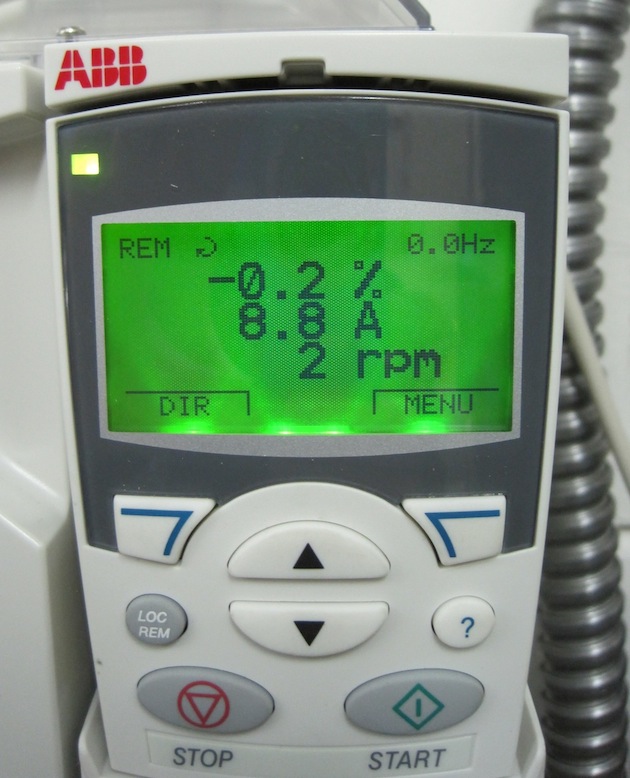
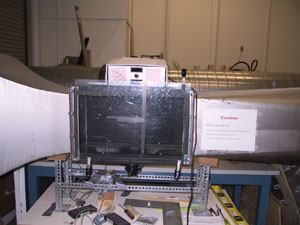
- The controller is on the pillar by the wind tunnel itself and the display is on the wall (See below).
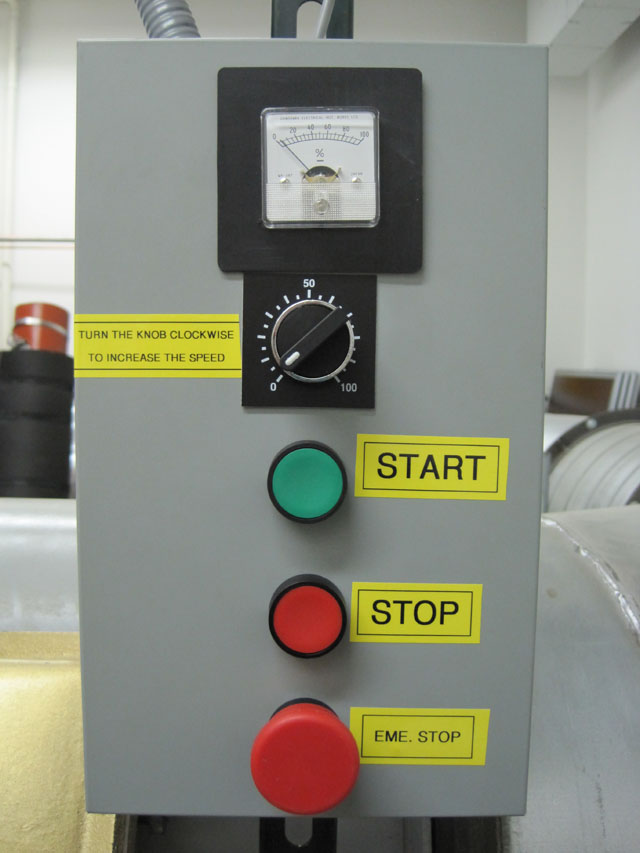
- Ensure that the speed knob on the controller is set to its minimum (full conterclockwise, currently indicates about 90. We're trying to get it fixed) and then push the Start button.
- Adjust the speed knob to the desired setting and read the RPM on the display on the wall (see below). Do not touch anything on or near the display.
- When you are done, set the speed knob to its minimum (full counterclockwise,) and push the stop button.
The Speed Controller on the Wind Tunnel
The Speed Display on the wall near the Wind Tunnel
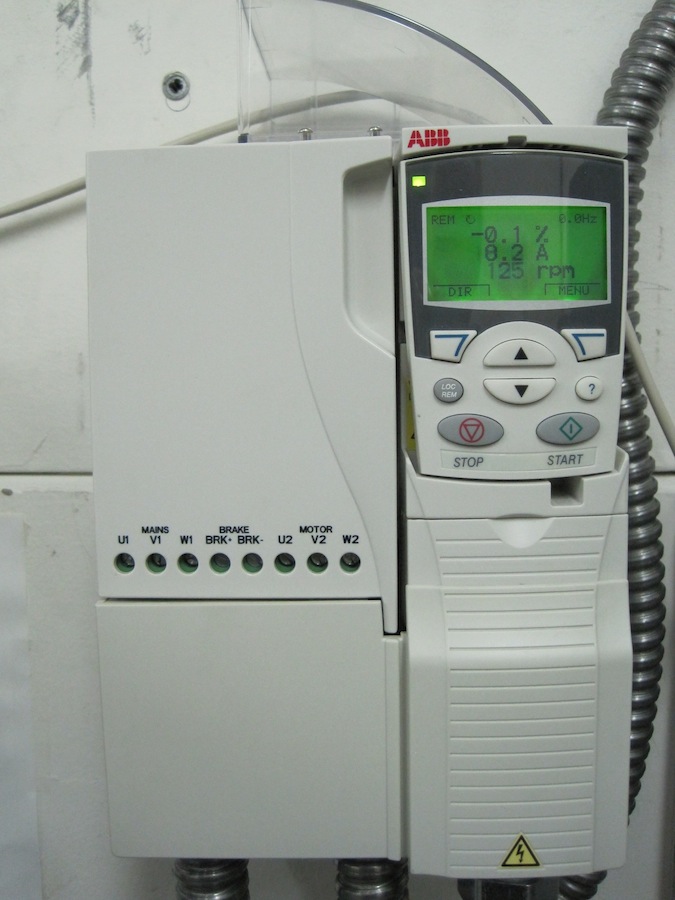
A close up of the speed display for the wind tunnel