Temperature Sensors and Calibration
Objective
By the end of the laboratory the student will:
- Calibrate a thermistor and determine the Steinhart-Hart constants.
- Calibrate a solid-state linear temperature sensor.
- Develop and calibrate a thermocouple-based temperature system with cold junction compensation.
Before You Begin
This lab will be done in sub-teams of two or three. Plan your time and workload accordingly. Bring your protoboard!
This lab builds extensively on the knowledge leared in the Op-Amps Lab. If you haven't done it yet, you might want to at least read through it. The instructions for this lab are not as detailed as for some of the earlier labs. You are expected to plan out your experiments and fill in the blanks. Ask a proctor or professor for help if you can't figure out what to do in a reasonable amount of time. If they don't know, call my cell and ask me.
Section 1 – Thermistor Calibration
There are at least three constant-temperature baths available for testing and calibration purposes. You can check the temperatures of your calibration baths with a Thermoworks USB reference Thermometer. It has a range from –55°C to 150°C, and a precision of ±0.05°C. Feel free to download the software (USB Reference Software) and install it on your laptop.
The first one is the ETI Mini Temperature Calibration Bath. It cools the contents to approximately 20°C below the ambient and will maintain an ice-water mixture at 0°C for several hours. You will need to go to the dining hall or other location and obtain enough ice to last for your lab period. Fill the covered cup 80% with ice. Add deionized water to fill it to about 90%. Put the cup in the device, plug in the device, and press the Cold button. The temperature of the stirred ice-water mixture should remain close to 0°C.
The second is the large Neslab chamber, which should be preset to 25°C. If it is not on, turn it on. Check to make certain that the set point is at 25.5°C. The sensor in the bath is off by about 0.5°C. Wait about 10 minutes for the bath to stabilize. The bath temperature should be within about 0.1°C of 25°C. It has to be shared by both teams.
The third is the beaker of deionized water stirred and heated by the SCILOGEX MS-H-Pro Plus Circular-top LCD Digital Hotplate Stirrer. The temperature can be set to any temperature from 10°C above room temperature to the boiling point. It takes about 20 minutes for the temperature to stabilize. It should remain within ±0.75°C of the setpoint once stabilized. Make certain that the temperature probe is in the water in the beaker before turning on the power. It has to be shared by both teams.
If they haven't yet been retured to the Chemistry Department, there are two additional stirred heaters that can be used to heat beakers of deionized water. Unless you reach the boiling point, the heater is only stable to ±5°C. Adjust the heater to provide your desired temperature. Be careful to avoid scalding yourself at temperatures above 50°C.
When using the calibration baths remember that water is an electrical conductor and putting an electronic component that is not waterproofed into water carries some risk. Use appropriate precautions. Masking tape is neither waterproof nor a good electrical insulator. Electrical tape and heat-shrink tubing are.
Calibrate (or verify the calibration of) one of the Semitec 104ET-1 (or Murata NXFT15WF104FA2B100 or Vishay NTCLE100E3104JB0) 100kΩ thermistors. Beyond the baths, the tools available for you to use are an HP 34401A 6-1/2 digit DMM , a myDAQ, a USB DAQ, and/or an oscilloscope. You may add any additional circuitry you deem appropriate. To verify the calibration, you need to compare your calculated fit against the constants in the data sheet.
Section 2 – Solid-State Temperature Sensor Calibration
Read the data sheet on the Microchip Technology MCP9701A-E/TO. It is probably not apparent on first reading, but it is designed to output a voltages linearly related to temperature. Design a circuit to test it and calibrate it with the constant temperature baths. Would soldered-on extension wires help? How does the processing to calculate the temperature from the measured voltage compare with that of the thermistor?
Section 3 – Thermocouples
Our available thermocouples are Type-E. Thermocouples generate very small voltages, which must normally be amplified to be read by a DAQ or oscilloscope, although the 6-1/2 Digit DMM has sufficient range. The easiest way to do the amplification is with an instrumentation amplifier. The one we have available is the Analog Devices AD623ANZ. Pay special attention to the voltage supply range. It can operate with a supply voltage range of ±2.5V (or 0-to-5V single sided) to ±6V (or 0-to-12V single sided). If you exceed the voltage supply range, you will destroy the chip. The op-amp standard of ±15V will destroy it immediately. Don't be tempted. Figure 50 in the data sheet shows the basic circuit for connecting a thermocouple. Note that in Figure 50, the amplifier is powered with a bipolar, not a single-sided supply. It looks like an op-amp, but it is not. Be sure to wire it properly.
The simplest way to construct a thermocouple is to use one of the existing ones. Otherwise, take a length of the 26-gauge thermocouple wire, strip the wires at one end and twist them firmly together so they make electrical contact. You can solder them together using a special indium-based solder (see Wlater Cook), but then you can only use the thermocouple at temperature below the melting point of solder. The wires can also be spot-welded together.
Design and build a circuit to read a thermocouple. To get practice for your future data logger, design the circuit to output voltages in either the 0-to-5V range or the 0-to-3.3V range. Create a VI to read the data and convert them into temperatures. Test your VI and thermocouple circuit in the calibration baths. How does the processing to calculate the temperature from the measured voltage compare with that of the thermistor?
Section 4 – Complete System
A complete thermocouple-based temperature measurement system requires cold junction compensation. You basically need something to measure the temperature of the junction where the thermocouple meets the instrumentation amplifier. Your choices (for this lab) are either a thermistor or a solid-state temperature sensor. In software, you read in the temperature of the junction, convert it to the voltage of your thermocouple at that temperature, and then add your measured thermocouple voltage and your CJC converted voltage together and then convert the sum to a temperature. You can look at the details of Convert Thermocouple Reading VI to get an idea of how it is done.
For this section, build a complete system with two thermocouples and attendant instrumentation amplifiers, and a CJC transducer on your protoboard and connect all three to a DAQ and write (or modify) a VI to read and plot the two thermocouple temperatures. You can also plot the CJC temperature if you wish.We strongly recommend you power your circuit with a ±5V supply. Test your complete system on the calibration baths. How well do the two thermocouples agree? Are the errors within the expected range from your error analysis?
Section 5 – Time Constants
A critical property of a temperature-measurement device is how quickly it responds to a change in external temperature. For most temperature-measurement devices, characterizing them as first-order systems is adequate for evaluating their suitability for a given application.
- For the thermistor measure the 1st-order time constant of the thermistor in stirred water by moving it from one constant temperature bath to another. Then measure the 1st-order time constant in air. How do your measured times constants compare with those on the data sheet?
- For the solid-state temperature sensor measure the 1st-order time constant of the sensor in stirred water. Then measure the 1st-order time constant in air. How do your measured times constants compare with those on the data sheet and that of the thermistor?
- Measure the 1st-order time constants of your thermocouples in the calibration baths and in air. How do your measured time constants compare with those on the data sheet and that of the thermistor?
When flying a rocket what temperatures would you be interested in measuring? What magnitudes and rates of temperature change do you expect for those temperature measurements? Using the rule of thumb that the time constant of the measurement system has to be 1/10th or smaller than the system being measured (or the bandwidth has to be ten times the bandwidth of the system being measured), how well would the different sensors work for making measurements aboard a rocket?
Extra Credit (Really worth doing if you fly a thermocouple or thermistor)
The time constants of temperature sensors on a rocket have to be very small because the flight time is so short. Make a thermocouple out of the 40-gauge thermocouple wire and measure its time constant in both water and air and compare it with the 26-gauge wire. Use Rocksim or OpenRocket and an Aerotech Arreaux rocket (arerotech_arreaux.rkt, aerotech_arreaux.ork) on an Aerotech G-79 motor to generate time versus altitude data. Then using the Standard Atmosphere model convert the data to time versus temperature data. Use the resultant data in a 1st-order model (such as FirstOrderResponse.vi) and plot how a 26-gauge and a 40-gauge thermocouple would respond to the expected temperature variations on a rocket. How well would the rocket measure the actual air temperature?
Extra Credit (Really worth doing if you fly a thermocouple)
The data logger on the rocket expects a voltage between 0 V and 3.3 V. In addition, battery-powered circuits are usually best if they are single-sided, not bipolar. Design, build, and test a complete system as in Section 4 with a single-sided 5V supply that outputs the CJC voltage and the two thermocouple voltages in the range of 0 to +3.3V for a CJC temperature of between +5°C and 50°C, and thermocouple temperatures between –10°C and 50°C.
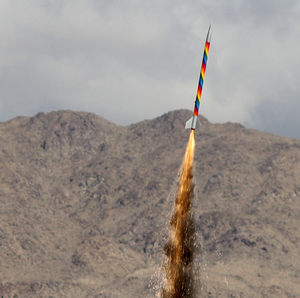
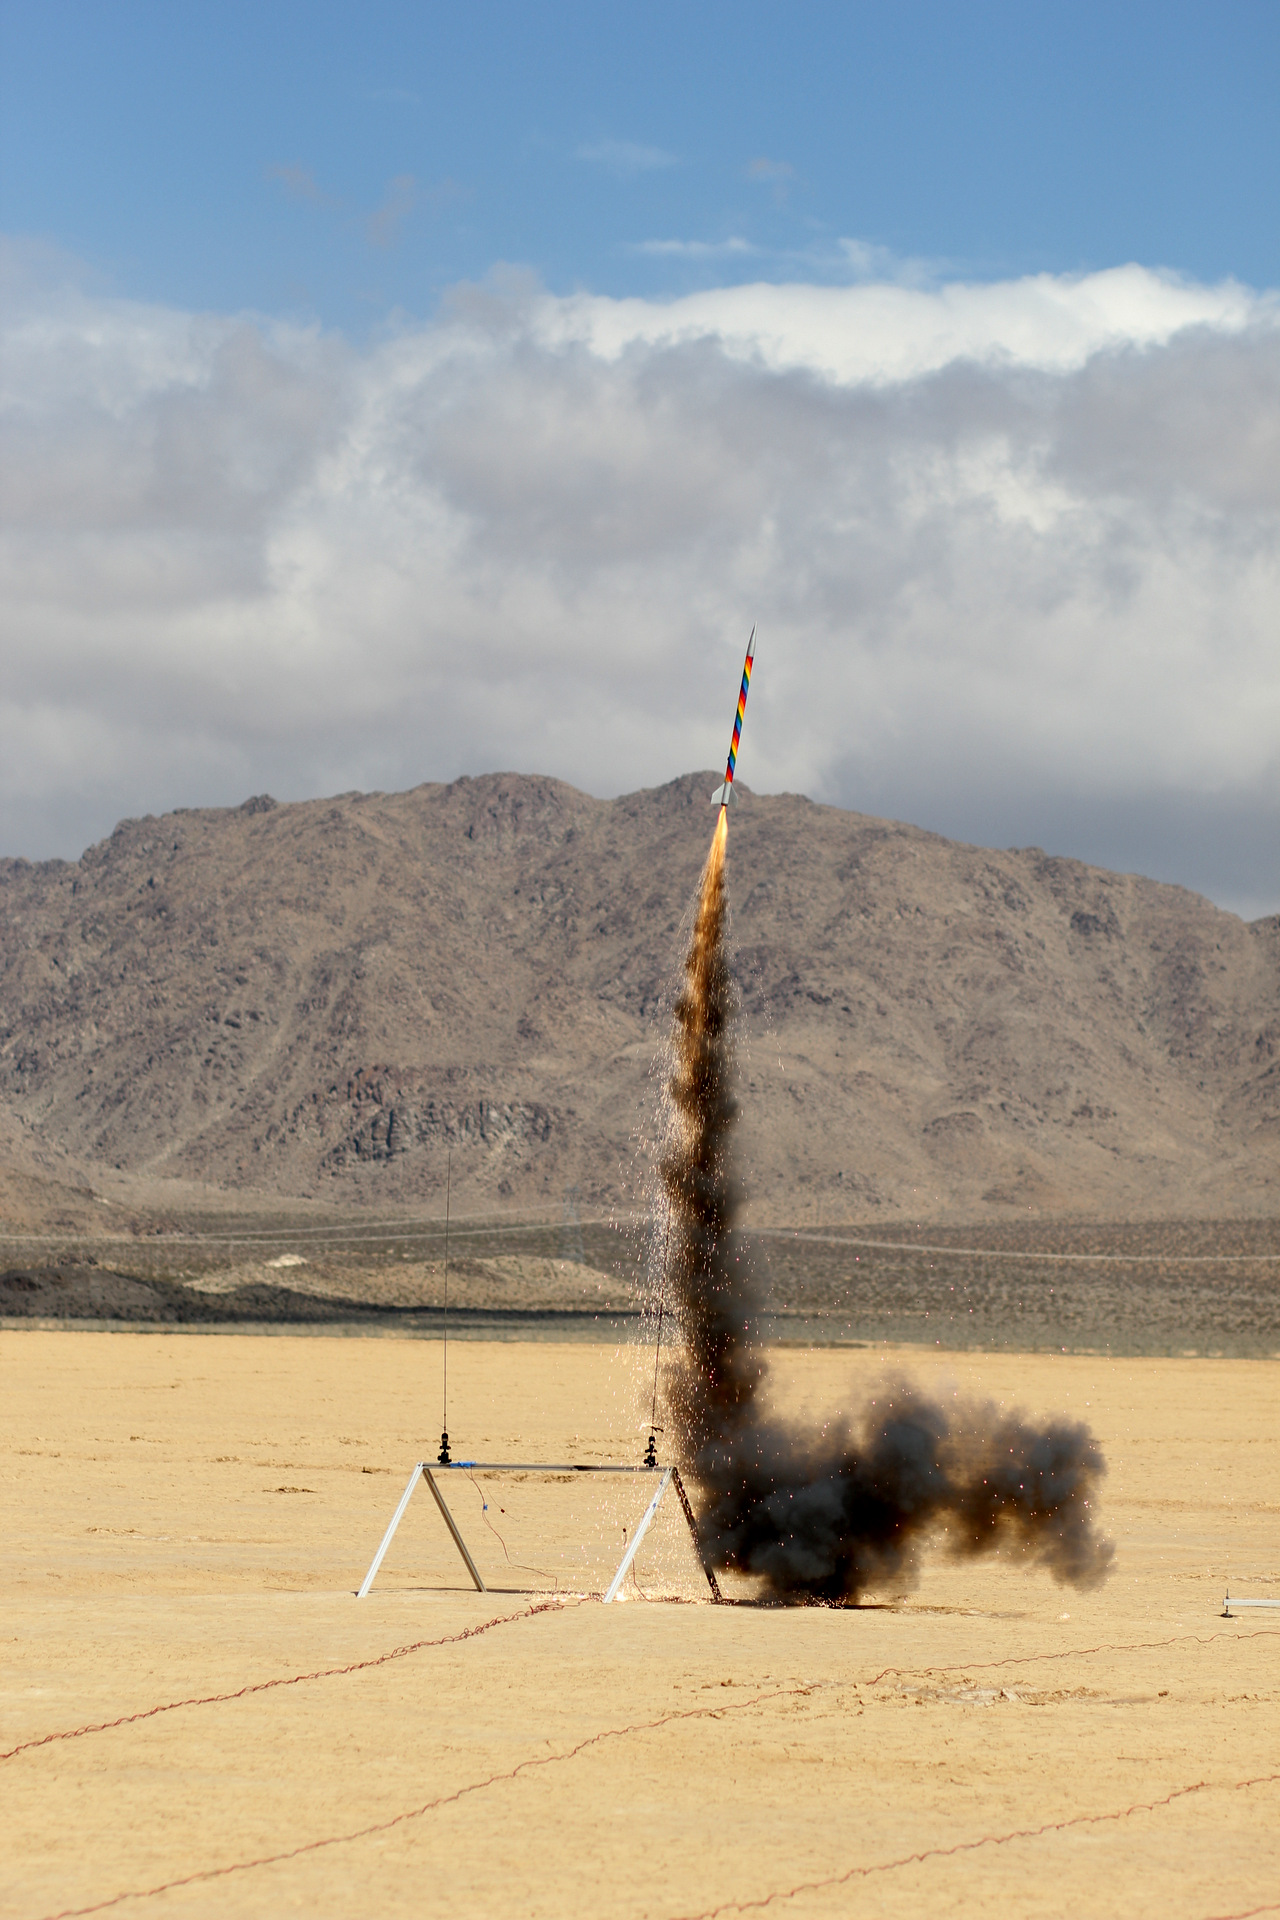
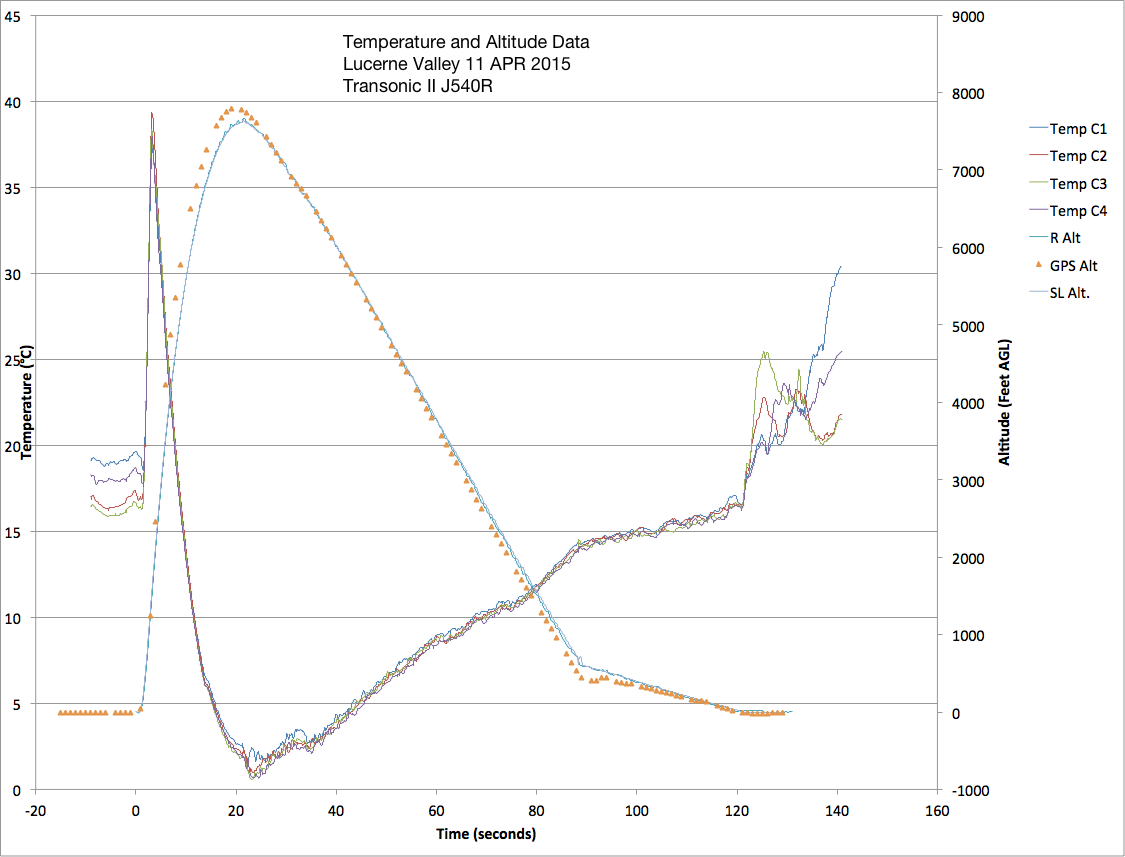
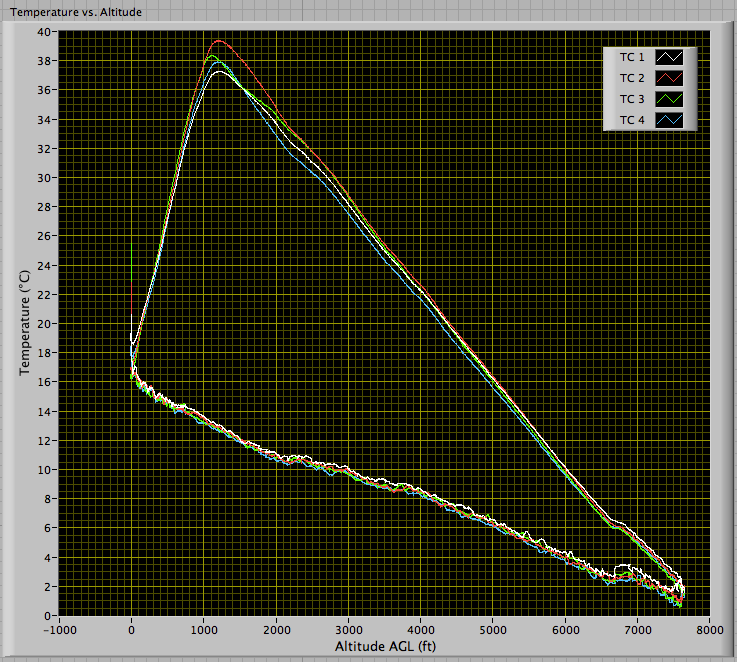
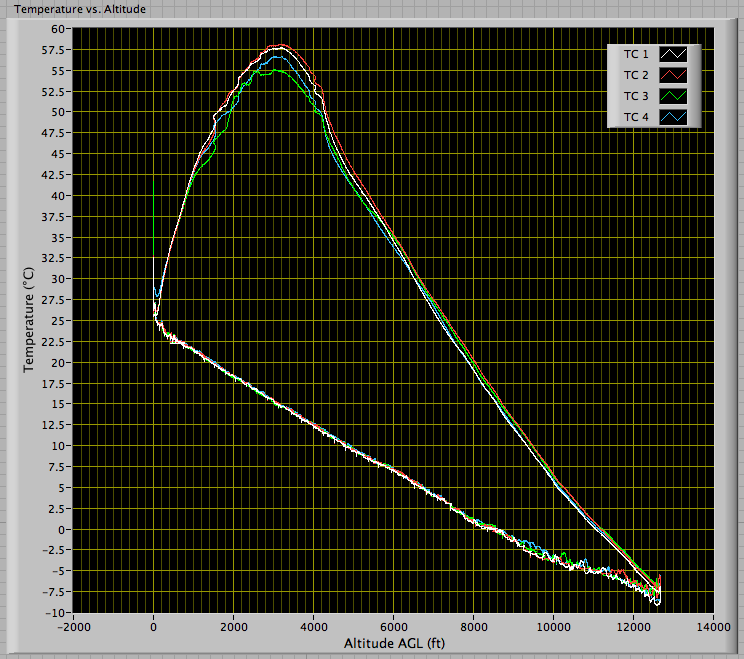
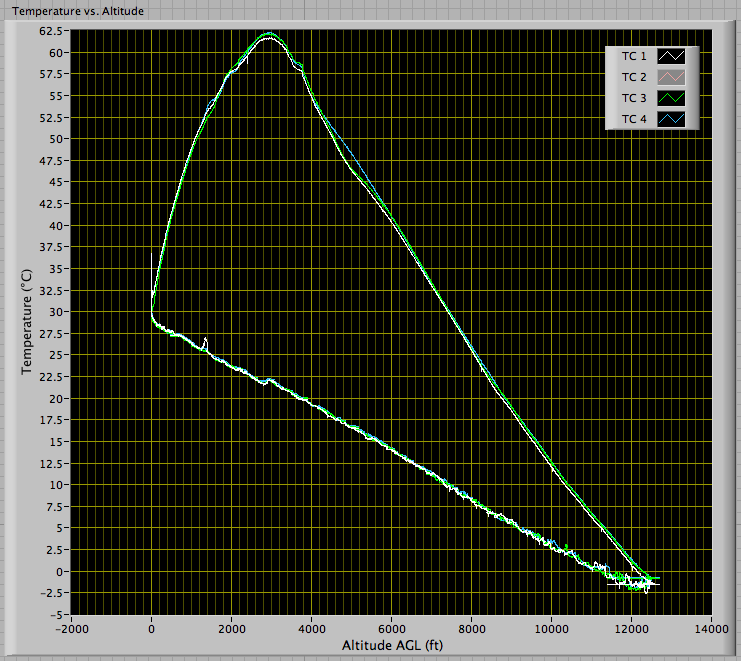
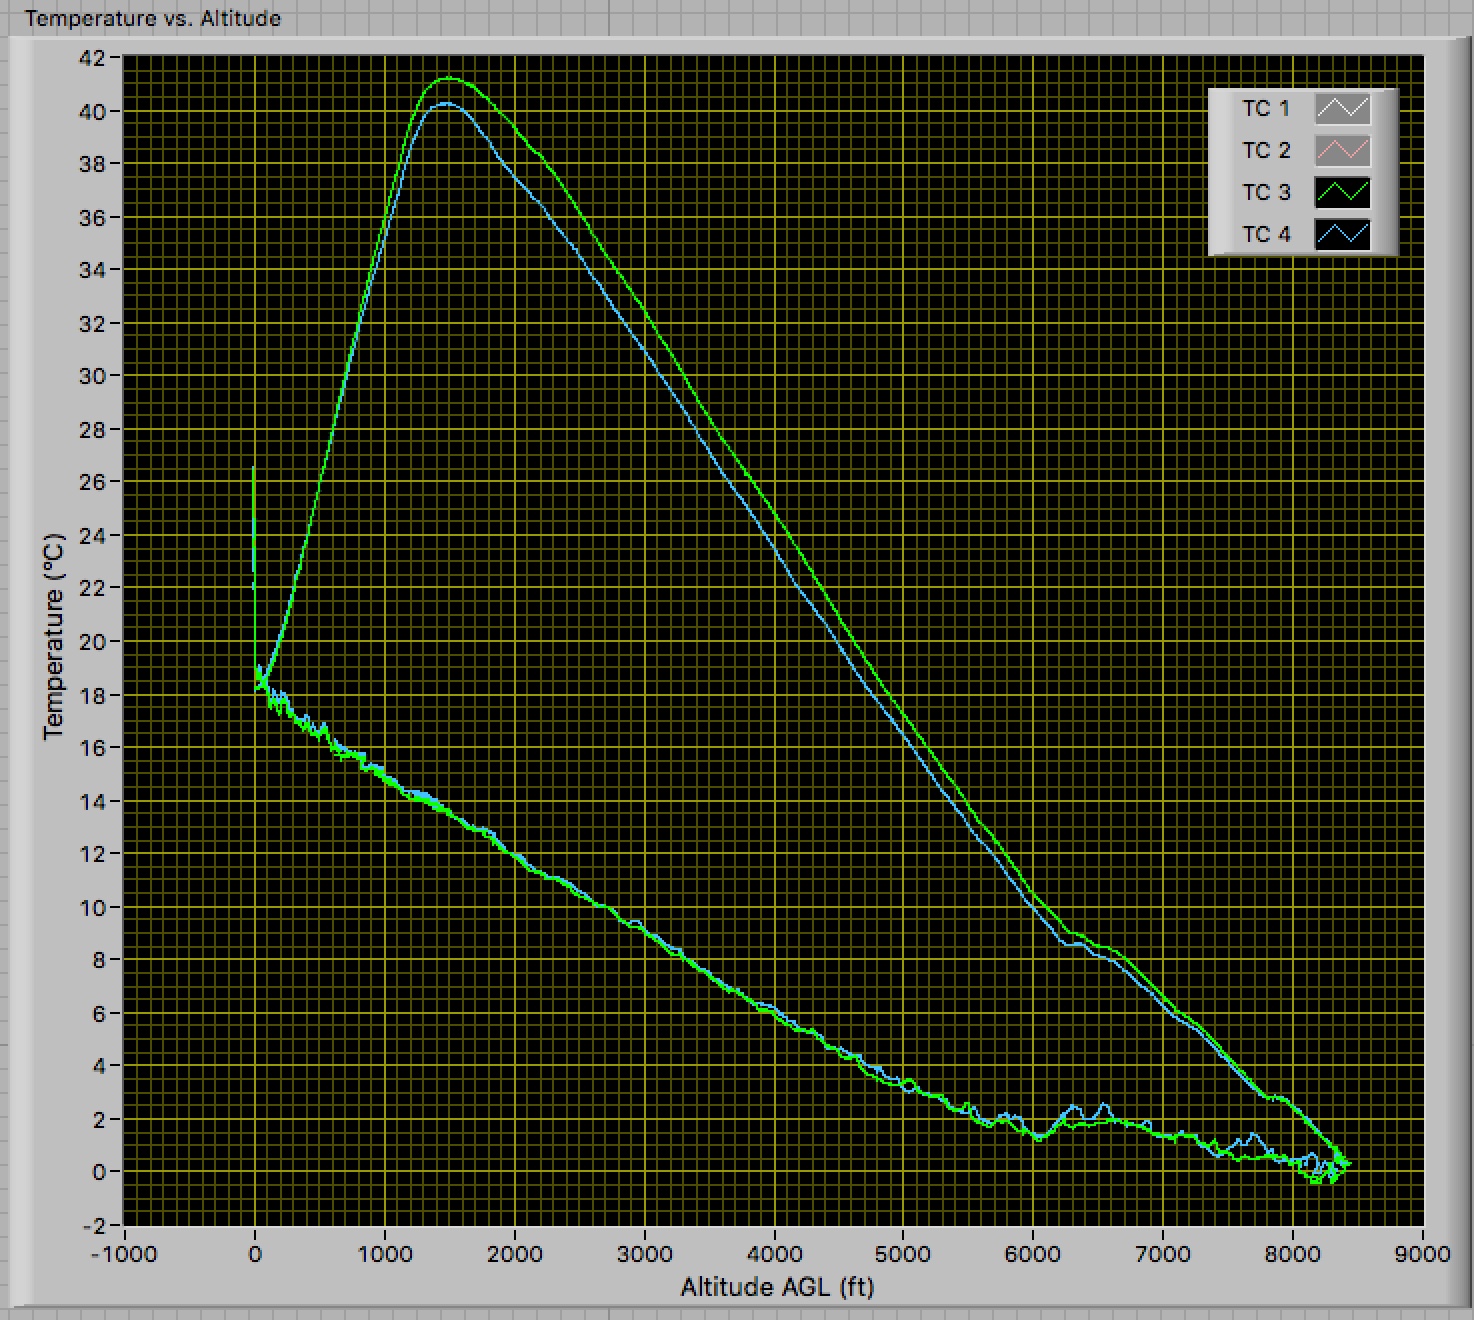
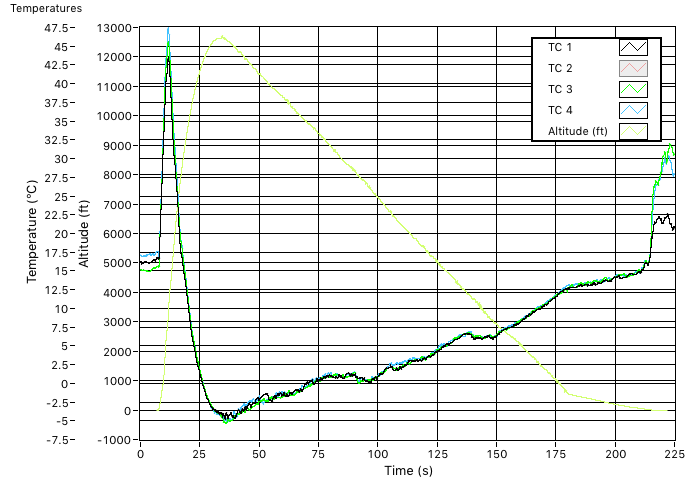
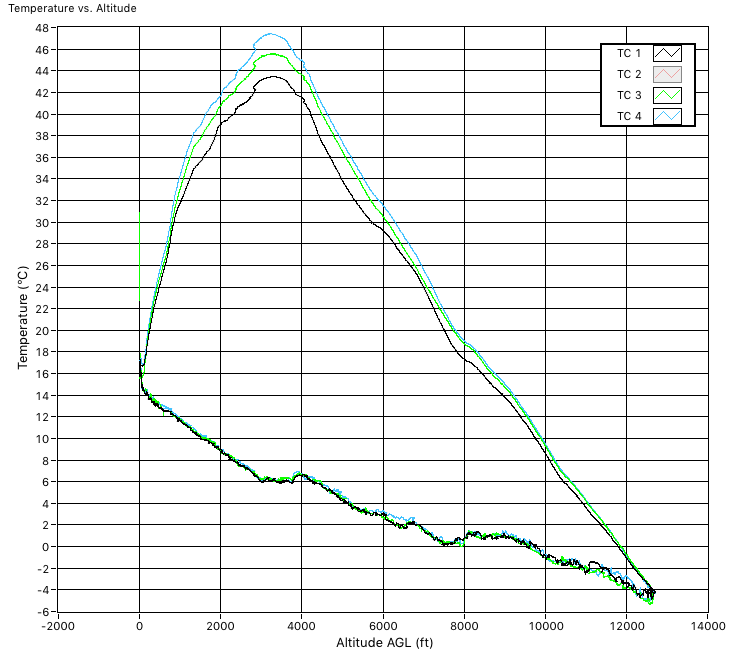
Actual Rocket Data
The E80 Temperature Rocket is used to measure the temperature at Lucerne Valley to give students actual data sets to compare against. The available data are shown below:
