LabVIEW Programming Assignments
Introduction and Schedule
The LabVIEW programming assignment are to be individual (not team) work. For all sections they are due by 5 PM in the relevant Sakai Assignment folder (one of the few actual uses for Sakai) on the date given below. If any assignment is taking more than 1/2 hour come see me. Our solution will be posted by Monday morning after the due date.
File Naming Convention
Your file name should be (Last Name)_(First Initial)_A(Assignment Number)_S(Section Number).(vi or llb). For example, if I were Greg Lake in Section 4 and I was turning in Assignment 3, my file would be named Lake_G_A3_S4.llb. If your file does not have the correct naming convention, it will not be graded.
LabVIEW Tutorial Videos
National Instruments has put together a series of instructional videos on LabVIEW. If you need assistance we recommend you watch them. If any assignment is taking longer than 1/2 hour, we have prepared a set of instructional videos that explain how to do the assignment. They are listed in the Assignment Due Dates table below.
Grading
Late assignments will not be accepted. The assignments will be graded on a five-point rubric scale:
| 5 |
– |
Wow |
| 4 |
– |
Good |
| 3 |
– |
Fair |
| 2 |
– |
Poor |
| 1 |
– |
Ouch |
| 0 |
– |
Not Submitted |
A VI that performs as described in the assignment description will receive a 4.
Assignment 1 – Read In Data File
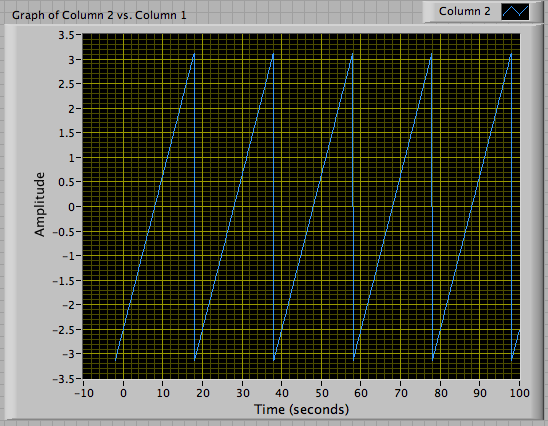
Create a VI that will open a tab-delimited text file of a matrix of values with four columns and an unspecified number of rows, such as created by Excel, and display the matrix as a 2-D array (or matrix). Separate out the columns as individual 1-D arrays, and plot the first two columns with Column 1 as the x-data and Column 2 as the y-data. Test your VI on this linked file. The result should resemble the following plot. The recommended sub-VIs, structures, and functions are: Read From Spreadsheet File.vi, Index Array, Bundle, XY Graph. The help video is Read In A File.
Assignment 2 – Write Out Data File
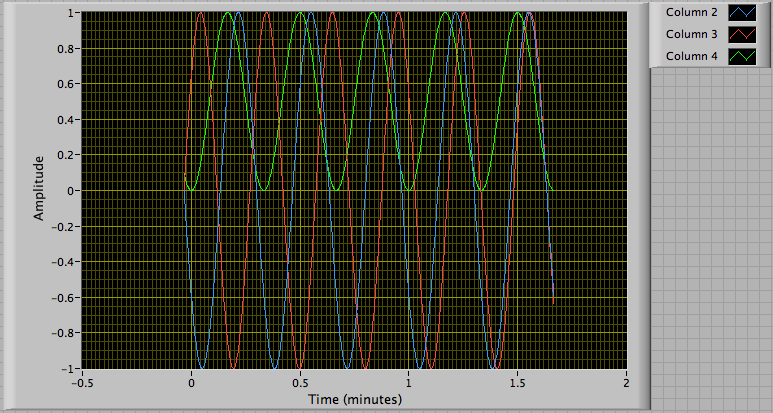
Starting from either your VI from Assignment 1 or the posted solution VI (it’s recommended to use it as a sub-VI), create a VI to read in a tab-delimited text file of a matrix with four columns, divide the first column by 60 (as in converting from seconds to minutes), take the sine of the second column, the cosine of the third column, and the square of the fourth column. Plot the second, third, and fourth columns as a function of the first. Write out the resulting data to a tab-delimited text file with the columns as columns. Test your VI on this linked file. It should resemble the following plot. The recommended sub-VIs and functions are: ReadInFile.vi (or your equivalent), Divide, Sine, Cosine, Square, Bundle, Build Array, Write To Spreadsheet File.vi, The recommended format string is "%g". The help video is Write A File.
Assignment 3 – Create Sub-VIs
Create four VIs: one that adds two numbers, one that subtracts one number from another, one that multiplies two numbers together, and one that divides one number by another. Each VI must have two input terminals, at least one output terminal, and a unique icon. Use these four VIs in a fifth VI that has two numeric inputs, at least one output, and an enumeration control, that uses a case structure to let the user choose addition, subtraction, multiplication, or division. Save them all in a common .llb library. Read here to create a .llb file or select LLB Manager under the Tools menu, and click on the Create New LLB icon. Read here to save VIs into a .llb file. The help video is Create Sub VIs.
Assignment 4 – Use a For Loop
Create a VI that uses a for loop and the random number generator on the Numeric Palette to generate an array of a specified length of uniformly distributed random numbers with a range of [0-1). Calculate the mean, standard deviation and root mean square of the array. Set the default length of the array to 100 samples.
Create another VI that replaces the for loop with the Uniform White Noise.vi on the Signal Generation Palette but otherwise behaves the same. Save them both in a common .llb library. Some recommended VIs and functions are: Random Number (0-1), Std Deviation and Variance.vi, RMS.vi . The help videos are For Loop Random Number Generator, and Signal Generator Random Numbers.
Assignment 5 – Use a While Loop and Shift Register
Create a VI that uses a while loop, a shift register, and the random number generator on the Numeric Palette to generate an array of a specified length of uniformly distributed random numbers with a range of [0-0.2] and from [0.3-1), In other words, the standard range for the random number generator but without any values between 0.2 and 0.3. Calculate the mean, standard deviation and root mean square of the array. Set the default length of the array to 100 samples.
Create another equivalent VI that uses the Uniform White Noise.vi on the Signal Generation Palette to generate an array and then uses a for loop to process the array and create an output array with all of the values between 0.2 and 0.3 missing. Is it possible to make the first VI generate a list of the exact specified length with a conditional on the stop control on the while loop? Is it possible to guarantee that the array from the second VI is the exact length specified? Save them both in a common .llb library. Some recommended VIs, structures, and functions are: Case Structure, Random Number (0-1), Std Deviation and Variance.vi, RMS.vi, Build Array, Greater?, Less?, And, Array Size, Array Subset. The help videos are While Loop Random Number Generator, and While Loop Random Number Generator.
Assignment 6 – Control Execution Timing
Create a VI that runs continuously until a front panel STOP button (not the abort button) is pushed. The VI should accept a two-digit hexidecimal number between 0 and FF inclusive. The VI should wait for 4.5 seconds, and then illuminate an LED for 0.5 seconds that indicates that the answer is about to be displayed, and then display the hexidecimal number as an array of binary LEDs. You can use TimerNoEdit.vi to view the functionality desired. Some recommended VIs, structures, and functions are: Stacked Sequence Structure or Flat Sequence Structure, Wait (ms), Number To Boolean Array, Reverse 1D Array, an array indicator with LED elements, a While Loop from the Express Palatte, and one or more Local Variables. You can change the Representation and Display Format of your input control by right clicking on it. The help video is Timed Loop Events.
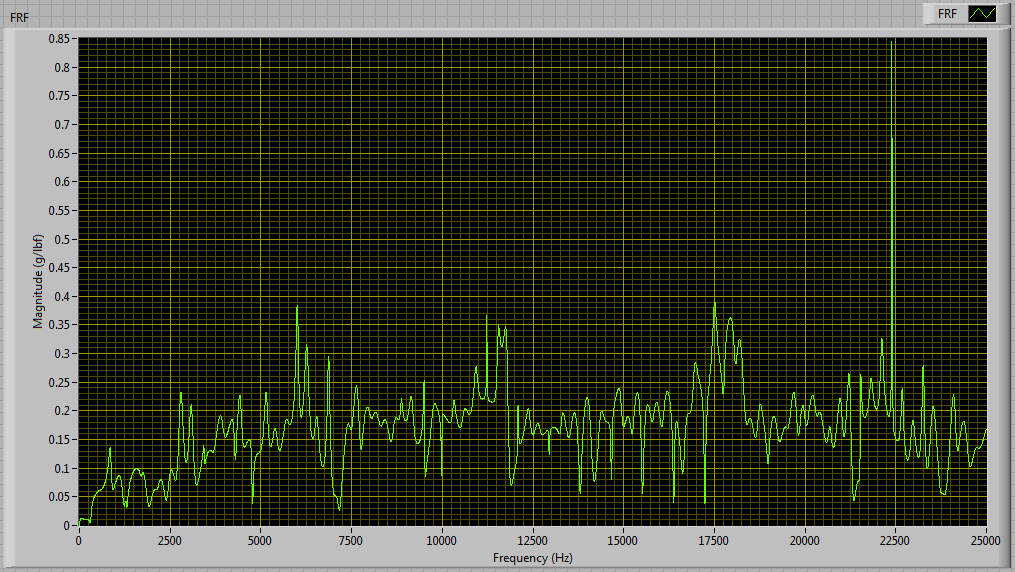
Assignment 7 – MathScript Frequency Response Function
Create a VI that uses MathScript (a MATLAB .m file) in a Mathscript Node to obtain Frequency Response Function (FRF, magnitude only) estimates. The estimate is computed as
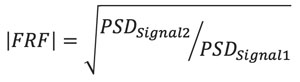
where, 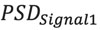 and
and 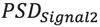 are the power spectral density (PSD) functions for each signal.
The PSD estimates are obtained using a curve fit approach whose fit order is a parameter you specify. Investigate how the fit order influences your result, using orders that range from 200 to 1000. The .m file to use is
E80frf.m. You will want to create input nodes on your Mathscript node entitled "data" (a 2D array) and "order" (a scalar), and an output node entitled "FRF" (a 2D complex array). A data file -
E80SampleData.txt - is available for your use and contains values of Time(s), Signal1(lb
f), Signal2(g). The linear output for an order of 200 should resemble
this plot. Make sure your VI allows you to plot the

estimate in linear, semilog-y, and log-log plots.
Recommended VIs: Read From Spreadsheet File.vi, Mathscript Node, Absolute Value, Index Array, Bundle, XY Graph. The help video is Use MathScript.
