Modal Vibrations in Rockets
Objective
By the end of the laboratory the student will:
- Compare the measured vibrational modes of a hollow tube with the theoretical predictions.
- Explain the difference between a dynamic strain gauge and an accelerometer.
- Measure the vibrational modes on a rocket.
- Determine how the expected vibrational modes can be measured with a low-resolution, low-frequency embedded DAQ.
- Compare a simple spring-mass-damper model with a more-advanced continuum vibrational model.
Section 1 – Theoretical Modes in a Hollow Cylinder
Calculate the frequencies of the first several modes of a hollow beam from the model given in the class notes, this reference, or your own sources, for a hollow cylinder made of polycarbonate and having the dimensions of the tap tube in the lab.
Also sketch or plot the mode shapes. At what locations would you find the maximum strain (flexing)? At what locations would you experience the maximum motion or acceleration?
Section 2 – Measurement of Hollow Cylinder Modes
The instructions for this lab are not as detailed as for some of the earlier labs. You are expected to plan out your experiments and fill in the blanks. Ask a proctor or professor for help if you can't figure out what to do.
- The piezoelectric dynamic strain gauges are installed underneath a layer of polycarbonate film. Installing and wiring the sensors is more of an art than a science. Your first action should be to determine which of the sensors are working and which sensor corresponds to which data channel on the computer. Use the CheckSensors.vi or your own VI or MatLab script to verify the sensor location and function. Include a sketch in your notebook (notebook use ended in 2012) of the locations.
- Next, verify the function of the triggering hammer. Use the CheckHammer.vi or your own VI or MatLab script to test the function of the hammer. The hammer should be connected to ACH8 (the ninth analog input channel) on the DAQ. The PCB hammer has no gain setting, but the PCB preamplifier should normally be set to a gain of 10 or 100. Connect the hammer to the preamplifier with the thin white cable with BNC connectors on both ends. Comment on the shape of the hammer pulse both with and without the 60 Hz filter. Practice getting single taps instead of double or triple taps.
- Use the DAQ and the TapTestFRF.vi or your own VI or MatLab script to determine the frequency and mode shape of the first several modes of the tap test tube and compare them with an analytical model. the default sample rate of TapTestFRF.vi is 12.5 kSPS per channel. TapTestFRF.vi is designed to allow you to average several taps at the same location and get a statistical measure of your FRF. When you tap the hammer, the system should trigger and display the transient vibrations. If the hammer pulse and the response are both acceptable (e.g., no double taps) click the Add Set button. When you have at least 4 acceptable taps at a given location, click on the Analyze button. The magnitude (in dB), phase (in degrees), and coherence will be displayed. The coherence is the statistical measure of how much of your response is due to your excitation and how much is due to random noise. Any value of the coherence above 0.8 is acceptable. The 60 Hz Filter? setting is up to you. It is used to remove 60 Hz noise from the sensors and hammer. Do different tap sites excite different modes to different amounts?
The Export Time Data will create a tab-delimited text file with all of the sensor and hammer pulses in the buffer. This file could be used for further processing if desired. Click on the Continue button if the error dialog box appears. Writing the files takes longer than the DAQ expects. There are no long-term consequences to the error.
The Export Frequency Data button will create a tab-delimited text file of the current analysis data. The data give the magnitude, phase, and coherence of each sensor as a function of frequency in Hz. This file could be used for further processing if desired.
For those who really want to see mode shapes, the VI Animation.vi is available. You enter the sensor positions, the magnitudes (absolute, not dB), and the phases in degrees, and it will show you the animated mode shapes.
- Some of the peaks in your FRF are caused by standing waves in the air of the tube. If possible, determine the frequency and mode shape of these peaks. A possible starting place is this reference.
- Accelerometers are more commonly used than dynamic strain gauges for modal vibration measurements. Make use of one of the small Dytran accelerometers (and associated preamplifier) to compare and contrast the information provided by the two types of sensors. Do they give the same sort of information? Are there situations where one or the other is to be preferred? The accelerometers attach with the blue wax (or the leftover red wax). Do not be excessive in your wax usage.
Section 3 – R-DAS Measurement of Hollow Cylinder Modes
Use the RDASSimTapTestFRF.vi and the DAQ to repeat your mode frequency and shape measurements to the greatest extent possible. The RDASSimTapTestFRF.vi simulates the voltage range, sampling rate, ADC accuracy, and data size of the R-DAS in software. The 0-5V range, 10-bit ADC, 200 Hz max sampling rate, 6-channel nature of the R-DAS create some interesting challenges in making you measurements. Use your resourcefulness to accomplish what you can. Explain any necessary changes in procedure, including those involving resolution, dynamic range, and aliasing or signal folding.
The instructions in this section are deliberately much less explicit than in Section 2. Consult a proctor or professor if you are struggling.
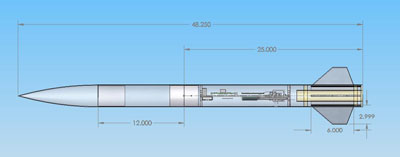
Section 4 – Full-Resolution Measurement of Rocket Modes
There is no easy way to connect the piezoelectric vibration sensors in the rocket to the DAQ, so high-resolution measurement of the rocket modes requires the accelerometer and the hammer. Is there a difference between tests where the accelerometer is fixed and the tap sites move and tests where the accelerometer is moved and the tap site is fixed? What are the mode frequencies and mode shapes of the rocket?
The instructions in this section are deliberately much less explicit than in Section 2. Consult a proctor or professor if you are struggling.
Section 5 – R-DAS Measurement of Rocket Modes
Measure the frequency and mode shape of the first several modes of your rocket using the on-board R-DAS and vibration sensors. Explain any necessary changes in procedure, including those involving resolution, dynamic range, and aliasing or signal folding.
How are you exciting the vibrations? Are you able to measure the excitation?
Develop a plan for analysis of modal vibrations on the rocket during flight.
Make special note of your expected excitation source.
The instructions in this section are deliberately much less explicit than in Section 2. Consult a proctor or professor if you are struggling.