Computer and Embedded-Processor Based Data Acquisition
Objective
By the end of the laboratory the student will:
- Design and build signal conditioning circuitry to interface transducers with a DAQ.
- Perform and report DC measurements and processing on a transducer with both a computer-based and an embedded-processor-based DAQ.
- Perform and report AC (frequency-response) measurements on a system with both a computer-based and an embedded-processor-based DAQ.
- Demonstrate the uses of the Nyquist limit and foldover.
Warning!!
Be very careful with the R-DAS components. You should apply
no signals to the R-DAS patch boxes (the black boxes with the 10 BNCs and the two binding posts)
unless the R-DAS is
on and
beeping. The voltage must be in the range of
0V to +5V DC. It cannot go negative (below 0V) or above +5V or you risk
destroying the R-DAS. They are about $300 apiece and come from the Netherlands, so your boo-boo will have long-term consequences for the class. Note, when you power on the signal generator, the output goes negative, so the signal generator should
never be connected to the R-DAS when it's unpowered or first turned on.
Please have the proctors or professors double-check your outputs before you connect them to the R-DAS.
Other Preparations
If you desire to use the pre made virtual instruments, please copy them from the LabVI folder into the folder corresponding to your Team and log in using your section number. You may also need to change the read only flag on your copied files.Many of the VIs generate tab-delimited text files that can be read in Excel, Word, Kaleidagrap, or Matlab. You are of course free to create your own VIs or Matlab scripts. Please leave your creations in the folder for your team and don't look in or place things in other folders.
You are free to modify your copies of the VIs in any manner you desire unless specific safety instructions specify otherwise.
There are detailed instructions for setting up the serial ports and the R-DAS components below. The R-DAS raw data format is the raw integer from the analog-to-digital converter. To convert from the raw value to a voltage, divide by the range of the 10-bit converter ( 210 = 1024) and multiply by the voltage span (5 V). For many analyses, the conversion isn't necessary.
Section 1 – DC signal processing
The vast majority of data acquisition systems measure a voltage at an instant in time. Almost all transducer outputs must be converted to voltages for measurement by a DAQ. For Section 1 you are to measure the resistance of a variable resistor with both the DAQCard-6036E in the computer and with the R-DAS used by the rocket.
The thermistors on the rocket behave as variable resistors whose resistance changes with temperature.
- Design and build a circuit that will convert the resistance of a variable resistor into a voltage measurable by the DAQCard. Assume you have access to a 5V voltage source and you may use one (1) additional component beyond connecting wires. The variable resistor will have a nominal (usual) value of 5kΩ but may vary up to 10kΩ and down to 1kΩ or below. Verify that the output voltage doesn't exceed 5 V for any value of the variable resistor in the given range.
- Interface the circuit with the ACH0 input on the DAQCard. With either LabVIEW
or Matlab have the DAQ/Computer system calculate the resistance of the variable resistor for several different resistance settings. Report the accuracy of the calculated measurements. You may either use the existing MeasCalcRes.vi or create your own VI or Matlab script.
- Verify that the circuit output doesn't exceed 5V. Interface the circuit with the R-DAS (connect your signal with one of the analog inputs, labeled AI0 through AI5). You may add a unity-gain voltage follower buffer amp if you desire (the input impedance on the R-DAS is approximately 1kΩ). Repeat your measurements in part (b) with the R-DAS. You may use either telemetry or on-board storage. Useful pre-existing VIs include RDASTelemCalcRes.vi for telemetry, and RDASRawFileRead.vi for on-board storage.
- If you have time, is there a way to avoid entering the reference voltage (5V) by hand? If so, implement and test your idea with the DAQCard.
Section 2 – Instrument Control
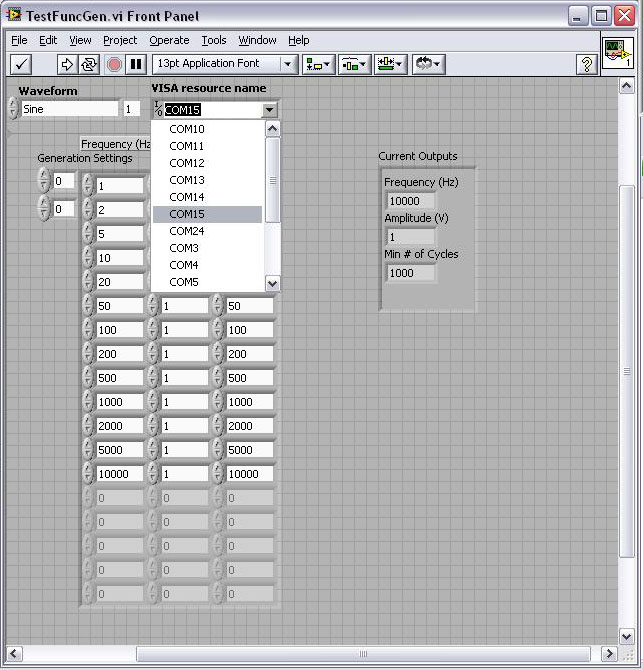
- Connect the RS-232-to-USB cable to the computer and the signal generator. Test computer control of the signal generator with the TestFuncGen.vi and verify the output signal with the oscilloscope.
- Connect the output of the signal generator to the ACH0 input of the DAQCard. Have the signal generator generate a series of sine waves at various frequencies and measure the frequency, amplitude, and phase of the sine waves with the DAQCard. You may use either TestFreqMeas.vi or a VI or Matlab script that you write yourself. Note that TestFreqMeas.vi measures the starting phase of the portion of the signal that you acquire, not the difference of the phase between two signals.
Section 3 – Bode Plot
You may want to review the sampling theorem before proceeding. A summary of the sampling theorem is found here.
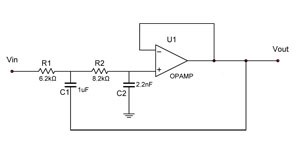
- Build the circuit shown below. If you are curious, you may simulate or analytically determine the function of the circuit. You can find information by doing a web search for "Sallen Key". For reference, C1 is 1 µF, C2 is 2.2 nF, R1 is 6.2 kΩ, R2 is 8.2 kΩ.
- Connect the output of the circuit to ACH0 on the DAQCard and connect the signal generator to the input of the circuit and to ACH1 of the DAQCard. Generate a Frequency-Magnitude-Phase plot of the frequency response of this circuit in both linear-linear and log-dB (Bode Plot) formats. You may use GenBodePlot.vi or create your own VI or Matlab script. It is not unwise to get a rough idea of the magnitude response of the circuit by hand measurement with the signal generator and the oscilloscope.
- Do not disassemble your circuit. You will need it for Section 4.
- If you have time, account for the fact that the DAQ doesn't sample both channels simultaneously. The Δt between channels is the smaller of 15 µs or 1/2 of the sample period. The sub-VI, CalcPhase.vi, has two additional inputs that will correct for the delay. See if you can wire them correctly.
Section 4 – More Signal Conditioning
- Design and build a circuit to condition a signal for the R-DAS. The input signal has a valid linear range of ±5V, but may exceed the valid range and may have excursions as large as ±10V or more. A signal into the R-DAS must be strictly limited to the range of 0-to-5 V and cannot exceed it. You want to maximize the signal so that the ±5V range comes as close as possible to filling the 0-to-5V range. However, overvoltages cannot go outside the 0-to-5V range.
- Verify the operation of your circuit with the signal generator.
- Build a second copy of your circuit. Have a proctor or professor verify the operation of both of your circuits.
- Connect the output of the signal generator to the input of one of your conditioning circuits and to the input of your circuit from Section 3. Connect the output of your Section 3 circuit to the input of your second signal conditioning circuit. Connect the output of the first signal conditioning circuit to AI1 (The second analog input)on the R-DAS. Connect the output of the second signal conditioning circuit to AI0 (the first analog input) on the R-DAS.
- Use the R-DAS to generate a Frequency-Magnitude-Phase plot of the frequency response of this circuit. Keep in mind that the telemetry sample rate is 10 Hz, and the maximum on-board sample rate is 200 Hz. You may record the data on-board, export it to a raw-data file, and then use RDASMakeBode.vi to analyze the file or VIs or Matlab scripts of your own making. Is there a way to “cheat” and extend the magnitude portion of the curve beyond the Nyquist limit? What is the key to “cheating” in this way? Keep this method in mind when testing the vibration response of the rocket.
If it isn't clear from the block diagram, RDASMakeBode.vi expects an R-DAS exported raw data file. When you run it, select the file you exported from the R-DAS. It will accept either Telemetry or On-Board exported data files. Then, use the controls to select a region of the data. It will caculate the amplitude or amplitude ratio and the phase or phase difference. If you're happy with the values, click Add Point to add the data to your Bode plot and then select your next region. Ask a proctor or professor if you still have questions.
Notes on Using Serial Ports in LabVIEW
Both the R-DAS telemetry VIs and the Function Generator VIs use serial port communications to talk to the instruments. Each computer has a slightly different collection of serial ports. The VI has to be told which serial port to use to communicate with the instrument. You set the port in the VISA resource name menu control. To determine the correct serial ports for the R-DAS Telemetry Receiver and the USB-232 USB-to-serial interface,
Connect the USB-miniUSB cable to both the computer and the R-DAS Telemetry Receiver and also connect the USB-232 to the a USB port on the computer.
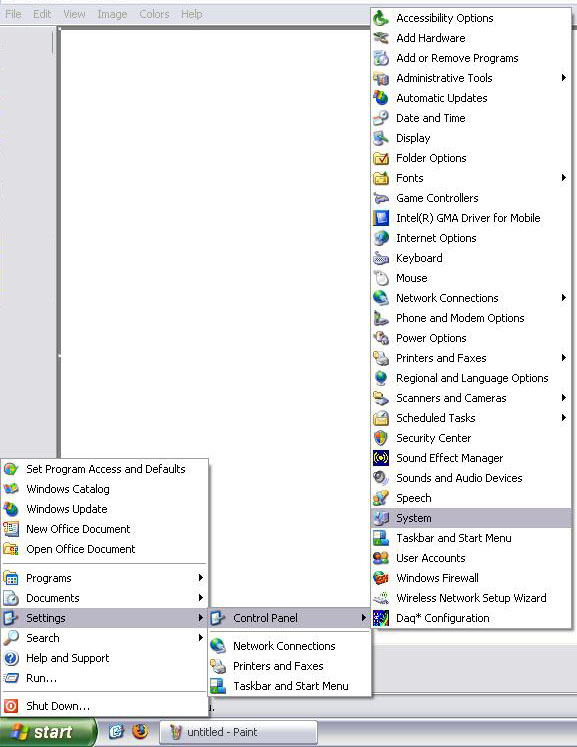
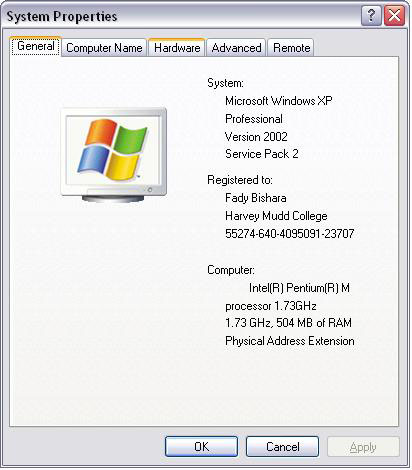
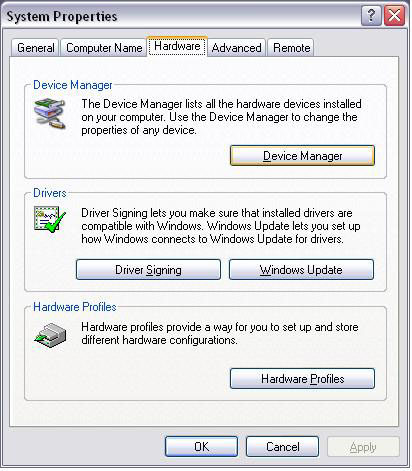
Under the Windows Start menu, go to the control panel, and then System (see figure below).
Click on the Hardware tab,
and then on Device Manager..
Scroll down (if necessary) and look at the Ports.
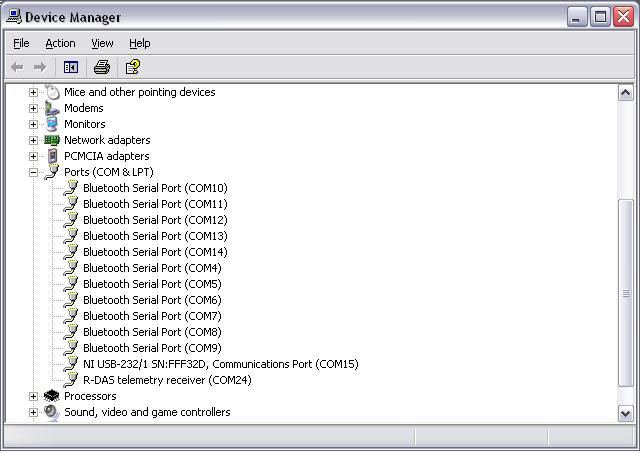
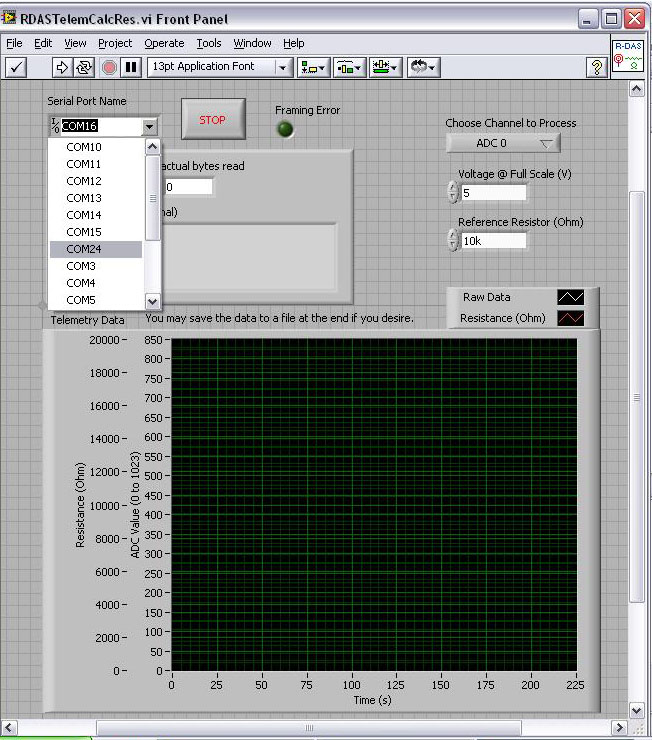
The R-DAS telemetry receiver port should be listed, usually around COM20 (in the above case COM24). The NI USB-232/1 should also be listed, usually around COM15 (as in this case). Make a note of both port numbers and close all of the windows you just opened. Before running any of the RDAS telemetry VIs, be sure to set the Serial Port Name to the one you just noted (illustrated below).
On rare occasions, Windows thinks that the R-DAS is a Microsoft Serial Pen or some sort of mouse and the cursor starts jumping around and random clicks start occurring. Simply unplug the R-DAS Telemetry Receiver, wait a while, and plug it back in.
Before running any of the VIs that control the signal generator, be sure to set the VISA resource name (the same thing as the Serial Port Name in the R-DAS Telemetry VIs) as illustrated below.
Notes on Using the R-DAS for Data Acquisition
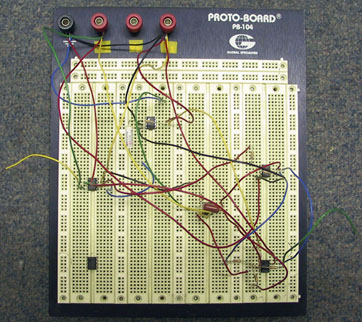
The R-DAS systems that we have consist of three pieces, the R-DAS itself, the R-DAS telemetry transmitter, and the R-DAS telemetry receiver. For this lab the R-DAS and the transmitter are mounted together on the board with the switches. Make sure the cable connecting them together is securely seated. The receivers are stand-alone and either have a USB connection or a serial connection.
The manual and the tiny addendum are available as PDF files. The native software for the R-DAS is the Rdas program which is already installed on the laptops. It can be used for set-up of the R-DAS and for data acquisition.
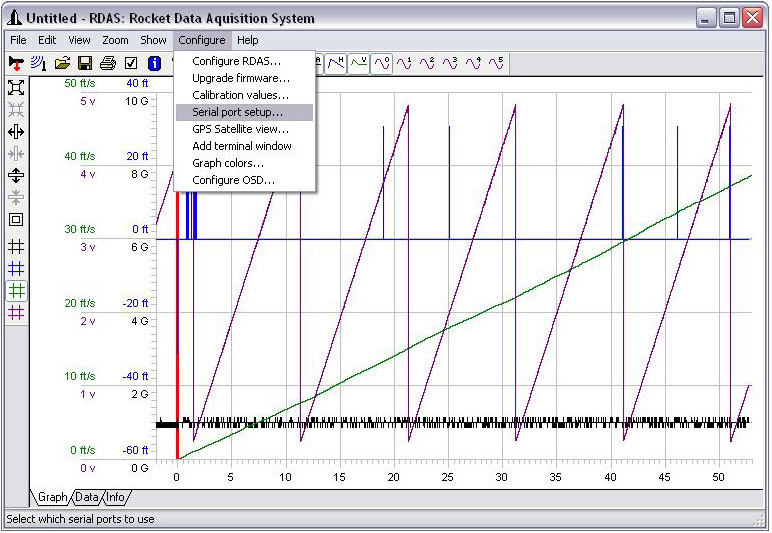
The initial state for the R-DAS should be with both switches flipped back toward the battery. There are two different methods for acquiring data from the R-DAS: on-board storage, and telemetry. To set up an R-DAS first flip the power switch (the one farthest from the antenna) forward (away from the battery), then connect it to the laptop with the USB cable (The USB port has enough power to drive the R-DAS by itself, but not quite enough to reliably drive both the R-DAS and transmitter). Start the R-DAS program. Under the Configure menu, choose Serial port setup....
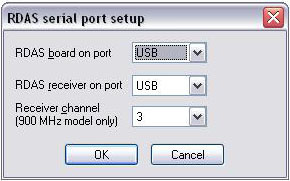
Set the RDAS board on port to USB (if it's not there already). Set the RDAS receiver on port to USB if using a USB model or to the serial port corresponding to the USB-232/1 if using the serial model. Set the Receiver channel to your team number (you'll have to double check this setting once you plug in the receiver). Click OK.
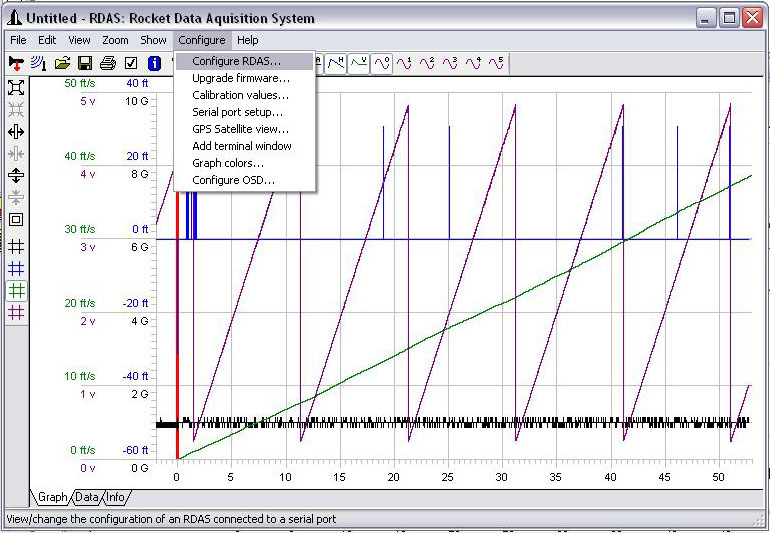
Under the Configure menu choose Configure RDAS....
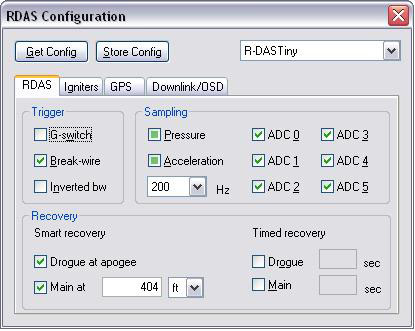
Click on the RDAS tab and click on Get Config. For the lab, you want to set Break-wire, Pressure, Acceleration, and channels ADC 0 through ADC 5. Setting Break-wire permits the second switch to simulate lift-off and begin data acquisition. The LabVIEW VIs that read the R-DAS files expect there to be data on all eight channels (Pressure, Acceleration, and ADC0 throught ADC5). The sample rate is for on-board storage. You get about 8 minutes of data at the maximum sample rate of 200 Hz. You may set it to whatever value you desire. It's OK to set Drogue at apogee. You can also set under Timed recovery, Drogue at 60 sec and Main at 120 sec.
Please read the manual and tiny addendum for details.
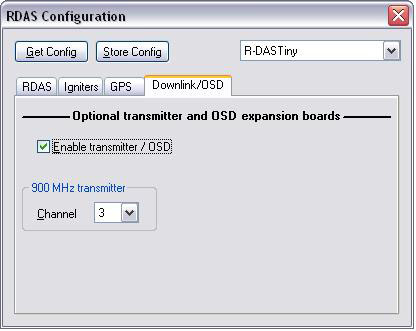
After everything is set, click on the Downlink/OSD tab. Enable the transmitter/OSD and set the channel to your team number. Then click on Store Config. If everything is OK the R-DAS will emit periodic single beeps.
On Board Data Acquisition
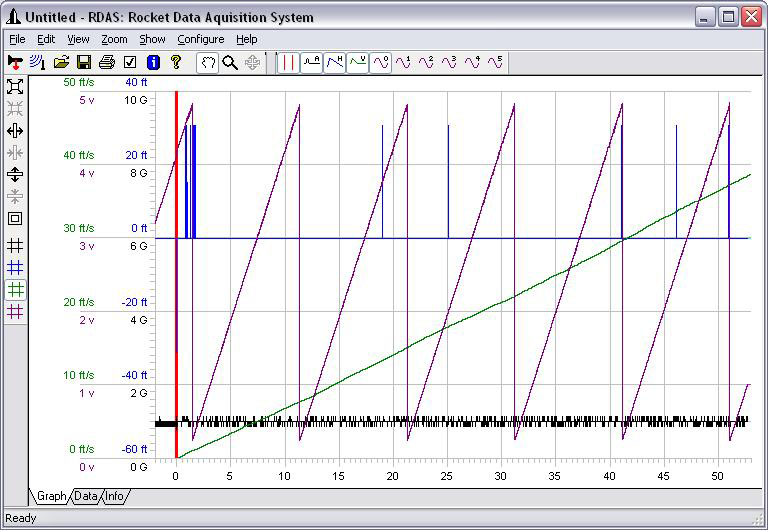
For on-board data acquisition you can either remove the USB cable or leave it connected. Flip the break-wire switch forward (away from the battery) and then flip it back toward the battery (so you don't forget for next time). Flipping the switch simulates launch and begins the collection of data. The R-DAS will switch from a single repeating beep (indicating ready) to a double repeating beep (indicating launch detected). The double beep will continue until apogee or the Timed recovery timer expires. After a brief pause, the R-DAS will give a low beep and then beep out the maximum altitude it reached (which should be pretty low for this experiment). But you knew all of this because you read the manual. right? When you've collected as much data as you desire, reconnect the USB cable (if not already connected) and click on the rocket-with-the-red-arrow icon. Your data will download to the Rdas program. To display the data in ADC 0 through ADC 5, click on the appropriate icon with a sine wave and a number.
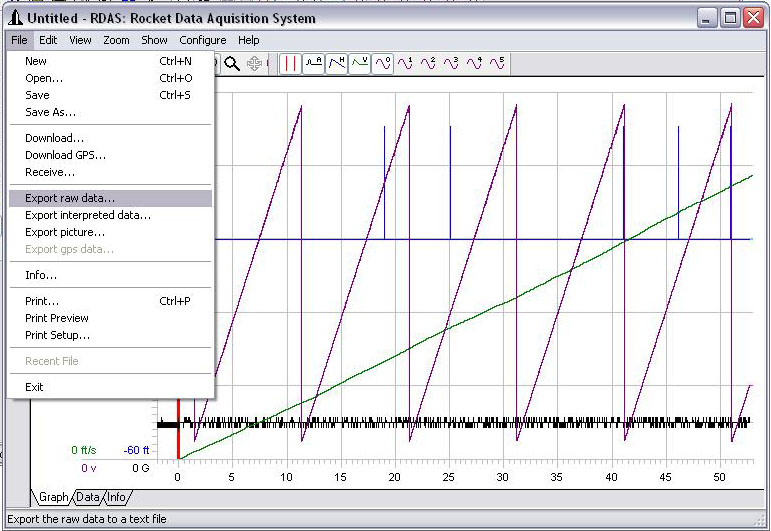
Exporting the data to LabVIEW is a two step process. First, under the File menu, choose Export raw data... and save the data file in your team's folder.
Next, use an appropriate VI, such as RDASRawFileRead.vi or RDASMakeBode.vi to read and/or analyze the file.
Telemetry Data Acquisition
Telemetry data can be gathered in a manner similar to the on-board storage, or LabVIEW can be used directly. In either case, make sure the R-DAS has been set up correctly and turned on. Next, connect the R-DAS telemetry receiver and set the serial port and channel (to your team's number) as explained above and displayed below.
Then, click on the radio wave icon just below the Edit menu.
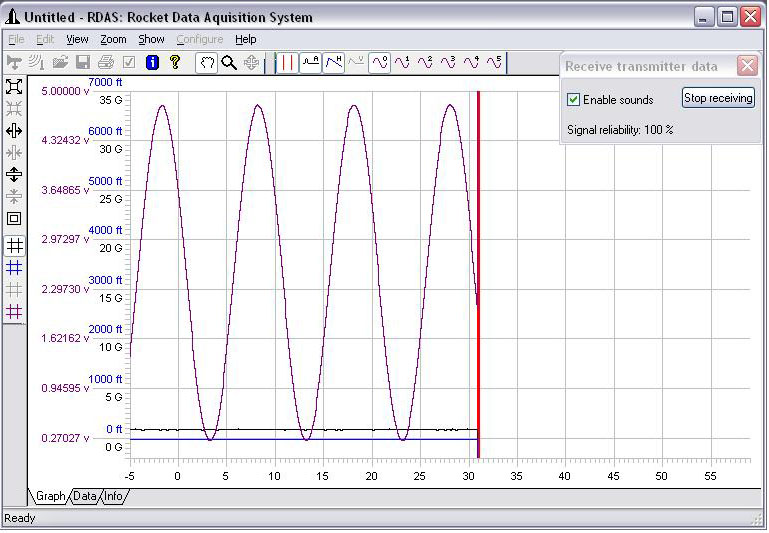
Make sure the red scrolling line is moving, and the Signal reliability is above 0%.
To use the Rdas program to collect the data, flip the breakwire switch on the R-DAS forward and back. When you've collected sufficient data, click on Stop receiving, and export the raw data as explained above. The telemetry sample rate is 10 Hz and cannot be changed.
To use LabVIEW directly, click on Stop receiving and quit Rdas. Open an appropriate VI, such as RDASTelemRead.vi, set the serial port as explained above, and run the VI.
Telemetry is excellent for long-duration, low-sample-rate experiments, but you need to use on-board storage for the highest sample rate.