The time and frequency of a portion of the flight are presented below. Click on the images to see the large versions. Then click the browser back arrow to return.
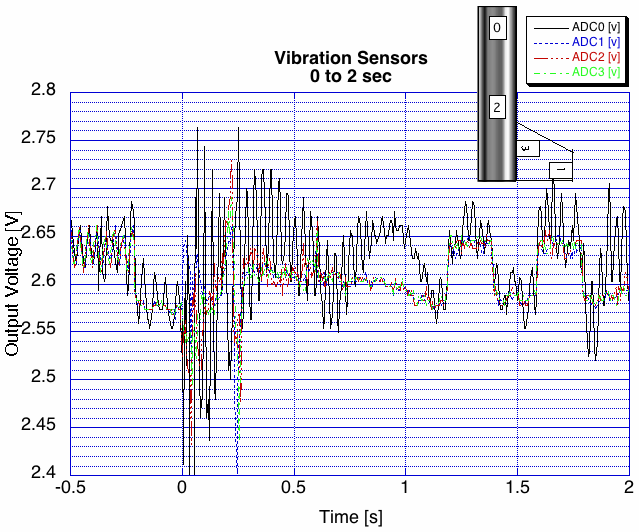
The motor ignited slightly before t=0. The t=0 point is where the accelerometer detected the start of high acceleration. The motor burned for about 2.5 seconds so these data cover most of the motor burn. Sensor 0 near the mid-point of the rocket picked up the most flexing of any sensor. The magnitudes of the vibrations were much lower than we were expecting. Ground-based tap tests showed peak signals that would have been ±2 V on this scale. The actual vibration was ±0.1 volt or less. The good news is that the rocket is a lot quieter than anticipated, probably because the burn has mostly a DC component with very few higher-frequency components. The bad news is that the vibrations aren't as large as anticipated so the SNR for the students doing their modal analysis will be substantially lower. The sensor amplifiers had a gain of 0.18. To scale the signal to the proper ±2.5 V (with a +2.5 V offset to scale to 0-5V), the sensor amps will need a gain of 4 to 5.
The rectangular-looking pulses at 1.2 and 1.6 seconds are from the R-DAS beeper. Again, we are guessing that the change is due principally to baseline shift from the current draw of the beeper and not to the beeping being picked up by the sensors.
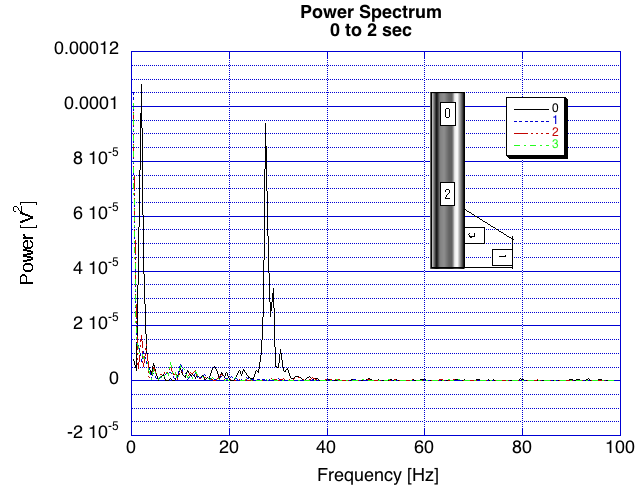
On a linear scale, there are two frequency peaks of note: One just below 2 Hz and onene just below 30 Hz being picked up by the sensor located approximately mid-rocket. Calculations and tap-test measurements on empty body tubes lead us to believe that the 30 Hz peak is the principal bending mode of the rocket. If the other three sensor were accelerometers instead of dynamic strain gauges, we believe that they would also have picked up this mode, but since the body tube and the fins don't flex, but simply translate, they don't record this signal. It is unclear what the cause of the lower frequency peak.
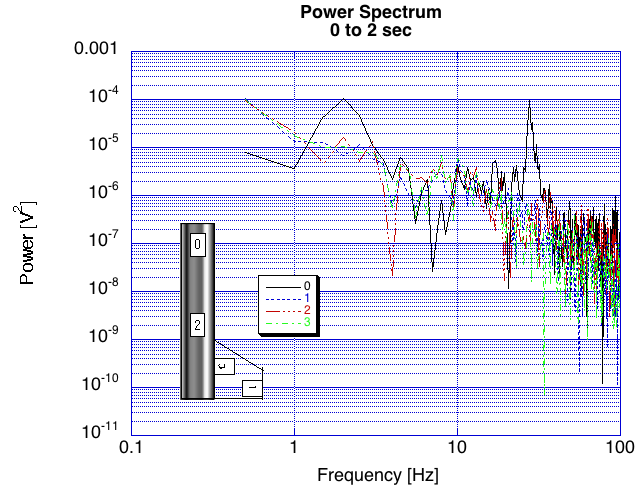
On the log-log plot the two peaks visible on the linear plot at (commentary to be finished soon).

We gratefully acknowledge the financial and/or in-kind support of Analog Devices, Apogee Components, and the Boeing Corporation for this project.
![]()
If you are interested in sponsoring the New E80 Laboratory please contact Prof. Erik Spjut.
We gratefully acknowledge D. R. Moore who provided the background photo and the photographs in the High Res Stills and the Med Res Stills.