The time and frequency of a portion of the flight are presented below. Click on the images to see the large versions. Then click the browser back arrow to return.
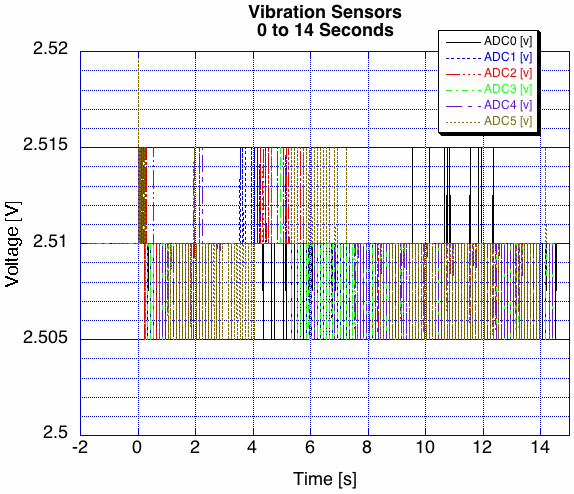
This is the text describing the time data in detail
This is more text describing the time data in detail.
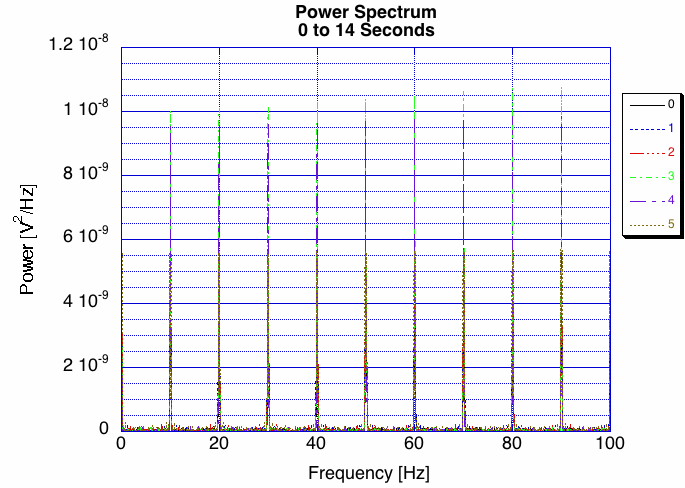
This is the text describing the linear frequency data .
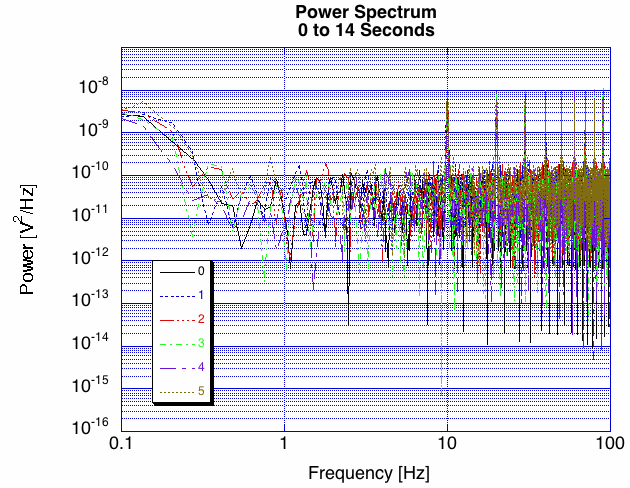
This is the text describing the log-log frequency data.

We gratefully acknowledge the financial and/or in-kind support of Analog Devices, Apogee Components, and the Boeing Corporation for this project.
![]()
If you are interested in sponsoring the New E80 Laboratory please contact Prof. Erik Spjut.
We gratefully acknowledge D. R. Moore who provided the background photo and the photographs in the High Res Stills and the Med Res Stills.