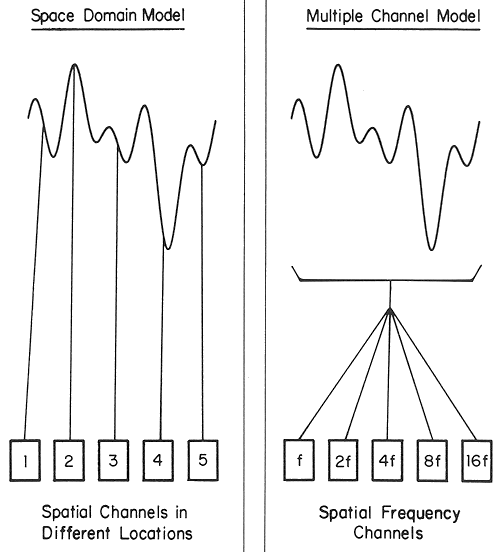
From the discussion above, we note that in the visual cortex the neurons selectively tuned to different spatial frequencies can be considered as a set of band-pass filters. The incoming visual signals are filtered and processed in parallel by an array of filter banks or channels. In other words, the visual signals are analyzed not only in spatial domain, but also in the spatial frequency domain.
We recall that in the primary visual cortex, most of the neurons, such as the simple cells (phase sensitive) and complex cells (phase insensitive), are also tuned to different orientations as well as different spatial frequencies. Again, before further discussion of the implication of having cells tuned to different orientations, let's first try this web demo to show the adaptation for spatial orientation.
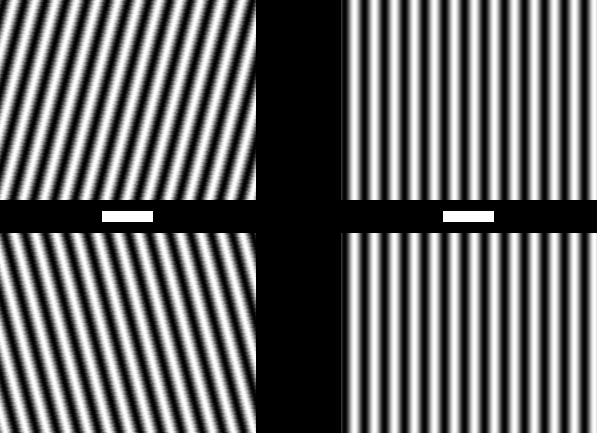
The result of the above demo showing adaptation to orientation can be explained in the very same way as the adaptation for spatial frequency.
Now we have shown that cells in V1 are selectively tuned to both spatial frequency and
orientation. These biological facts can also be described mathematically. A visual stimulus
is by nature 2D spatial signals ![]() and their Fourier spectra
and their Fourier spectra
![]() in the spatial frequency domain are also 2D functions of two independent variables,
in the spatial frequency domain are also 2D functions of two independent variables, ![]() and
and ![]() , the spatial frequency in
, the spatial frequency in ![]() and
and ![]() direction. Alternatively, the spatial
spectum can be represented as 2D funcitons of orientation and frequency along that direction:
direction. Alternatively, the spatial
spectum can be represented as 2D funcitons of orientation and frequency along that direction:
![\begin{displaymath}\left\{ \begin{array}{l} \omega \stackrel{\triangle}{=} \sqrt...
...triangle}{=} tan^{-1} [\omega_y/\omega_x]
\end{array} \right.
\end{displaymath}](img9.png)
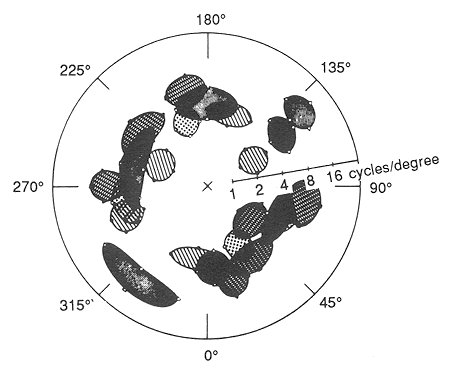
The following figure shows spatial freqneucy tunings of several striate cortex cells in macaque monkey (DeValois et al. 1982). The preferred orientations cover the entire 360 degree range and the preferred frequencies range from 1 to 16 cpd (cycle per degree). It is a reasonable assumption that a larger population of cells would fill this spatial freuqnecy space to completely represent all possible orientations and frequencies in the visual field.
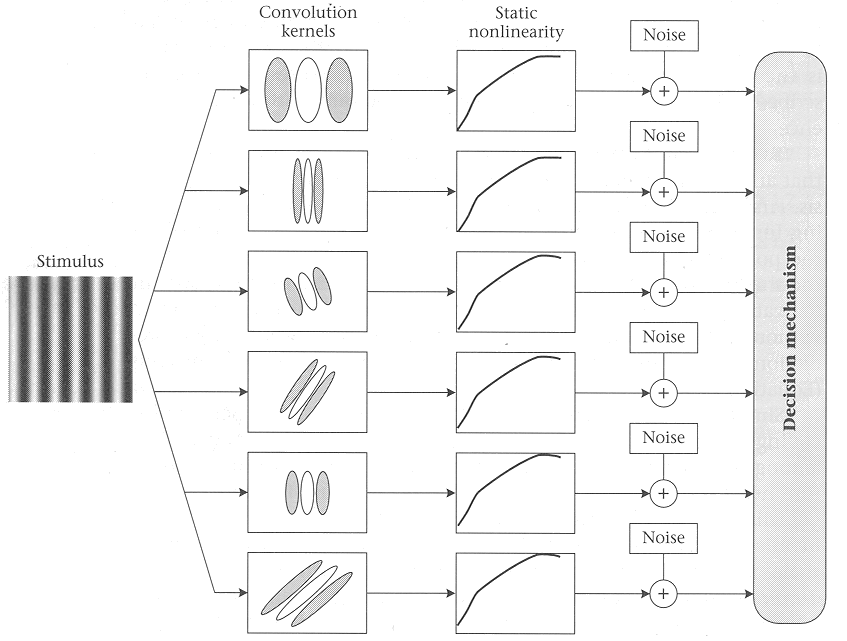
If we assme a set of neighboring cells sharing approximately the same receptive field
(i.e., receiving the same visual information from a local region in the visual field)
are selectively tuned to different orientations (
![]() ) and spatial frequencies
(
) and spatial frequencies
(
![]() ), then we see that each one of these cells will contribute some
information (or energy) to the 2D spectra
), then we see that each one of these cells will contribute some
information (or energy) to the 2D spectra
![]() , rather than to the 2D spatial
signal
, rather than to the 2D spatial
signal ![]() . In other words, in the visual cortex, the 2D visual signals in a local region
of the visual field are represented and analyzed in the spatial frequency domain.
. In other words, in the visual cortex, the 2D visual signals in a local region
of the visual field are represented and analyzed in the spatial frequency domain.
As the result, the idea of filter bank developed above can be expanded to include multiple channels for different spatial orientations as well as different spatial frequencies. This idea of multiple channels is illustrated below. It can therefore be concluded that the cells selectively tuned to different orientations and spatial frequencies can be considered to form multiple channels capable to process the 2D visual signals in the spatial frequency domain.
evidence of spatial frequency analysis...