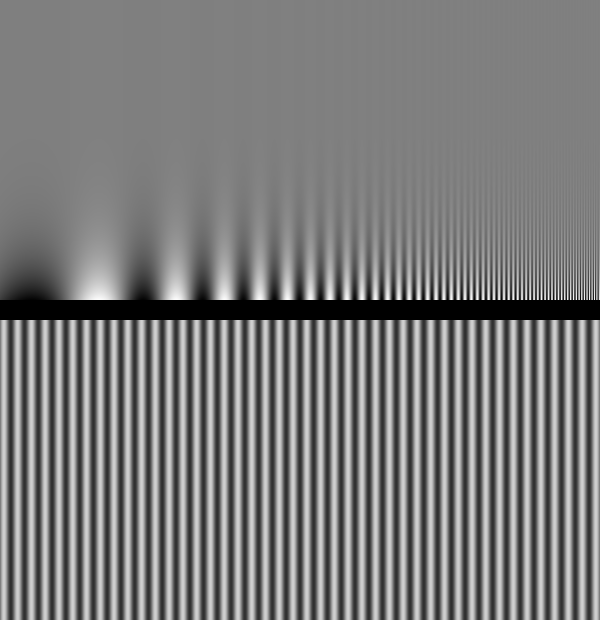
Again adaptation can be used to test this theory psychophysically as shown in the figure below. First view the grating (lower image) of a certain spatial frequency, say in the middle range of the CSF image, for a prolonged period. Then look at the CSF image (top) again, you may find that somewhere in the middle range of the CSF curve (corresponding to the frequency of the grating viewed before) is lowered (a dip).

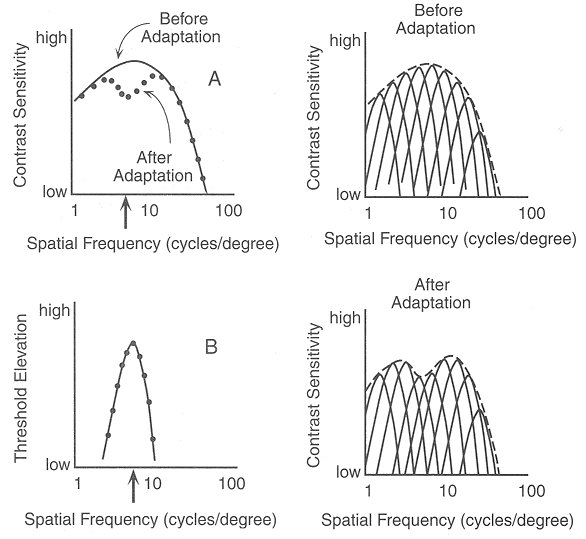
This result can be explained based on adaptation. During the viewing of the grating, neurons tuned for this particular frequency are adapted and their responses reduced. And it is this reduction of sensitivity that causes the middle range of the CSF curve to have a dip. This idea can be illustrated below:
