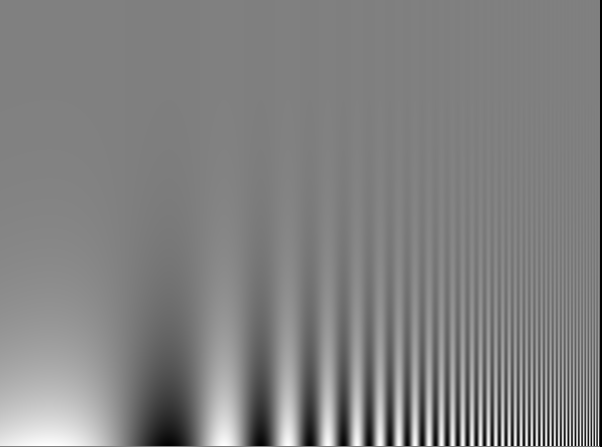
The contrast sensitivity as a function of spatial frequency (called CSF) can be obtained psychophysically from the test image below. You will perceive a curve which peaks at some certain optimal frequency in the middle range of the image (depending on the viewing distance) at which the visual system is most sensitive to the contrast. The sensitivity is reduced when the frequency is either too high or too low.

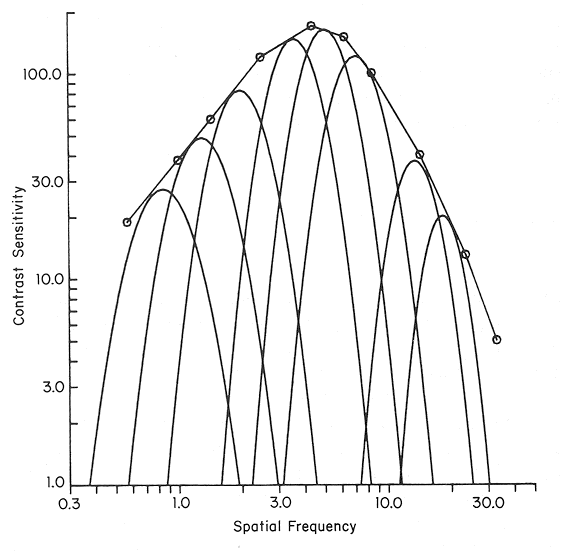
One way to account for this psychophysical result is to assume that this CSF curve is the superposition of spatial freqnecy tuning curves of the many individual cells in the visual cortex, as shown here:

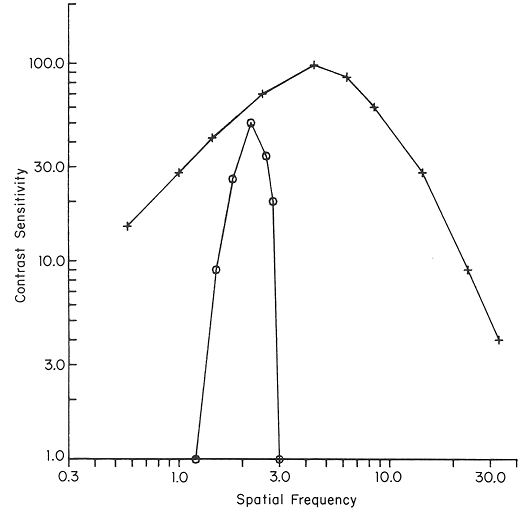
The psychophysical and neurophisiological data supporting this idea is shown here:
