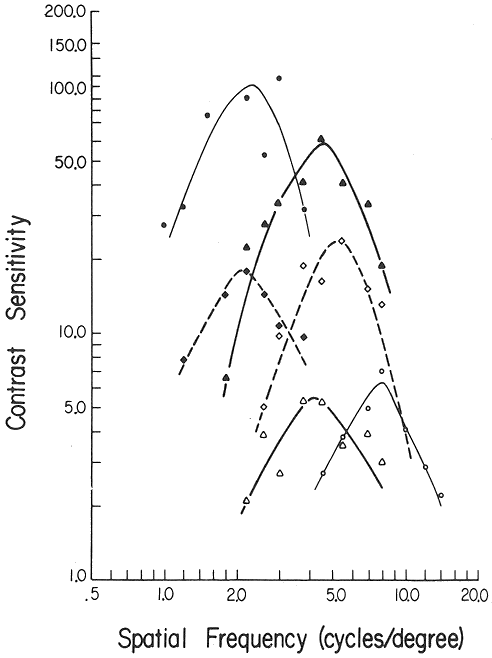
Most of the V1 cells are selective to spatial frequency (simple cells are phase sensitive while complex cells are not). The response magnitude of a given cell to different spatial frequencies forms a tuning curve which peaks at some certain optimal frequency and goes down when the frequency is either higher or lower than the optimal one. These cells form a continuim in terms of their optimal frequencies ranging from low spatial frequency of about 2 cpd (cycles/degree) to high spatial frequency of about 10 cyd.

The bandwidth of a spatial frequency tuning is defined as the frequency difference between the two frequencies where the amplitude of the response is half of the peak (one higher and the other lower than the peak frequency).
Before we further discuss the implication of having cells tuned to different frequency bands, let's first try this psychophysical experiment.
You realize that the spatial frequencies of the two gratings on the right are the same. If you stare at the two gratings on the left (fixating on the horizontal bar in the middle) for a minute or so, and quickly go back to the right to fixate on the bar between the two gratings on the right, you will find the frequency of the grating on top seems to be lower than that of the bottom grating.
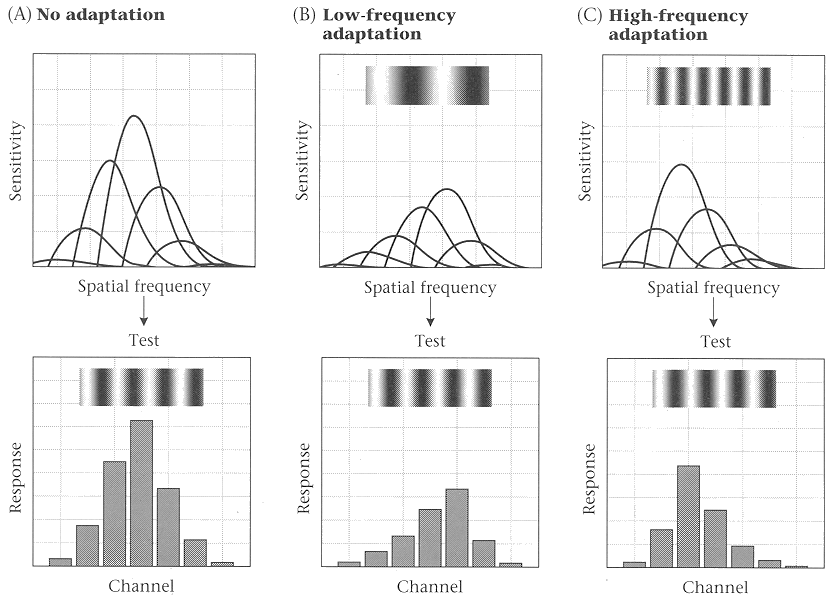
This result can be explained by neuronal adaptation (or fatigue), i.e., the reduction of responses (firing rate) after prolonged excitation. Specifically in this case, when you stare at the gratings on the left, the cells corresponding to the upper half in the visual field and sensitive to high frequencies reduce their responses, and so do the cells corresponding to the lower half and sensitive to low frequencies. When you shift your gaze from the left to the right these cells are exposed to the gratings of same frequency, and those cells favoring and still adapted to high frequency in the upper visual field will respond less strongly than those favoring lower frequencies, while it is the opposite situation in the lower visual field. If we assume the perceived frequency is the result of the comparions among different channels in the visual system each preferring a different band of frequencies, the illusion of seeing frequencies lower or higher than the reality can be accounted for, such as shown in this figure:
