

Next: Fourier Filtering 2D
Up: fourier
Previous: Spectrum Centralization

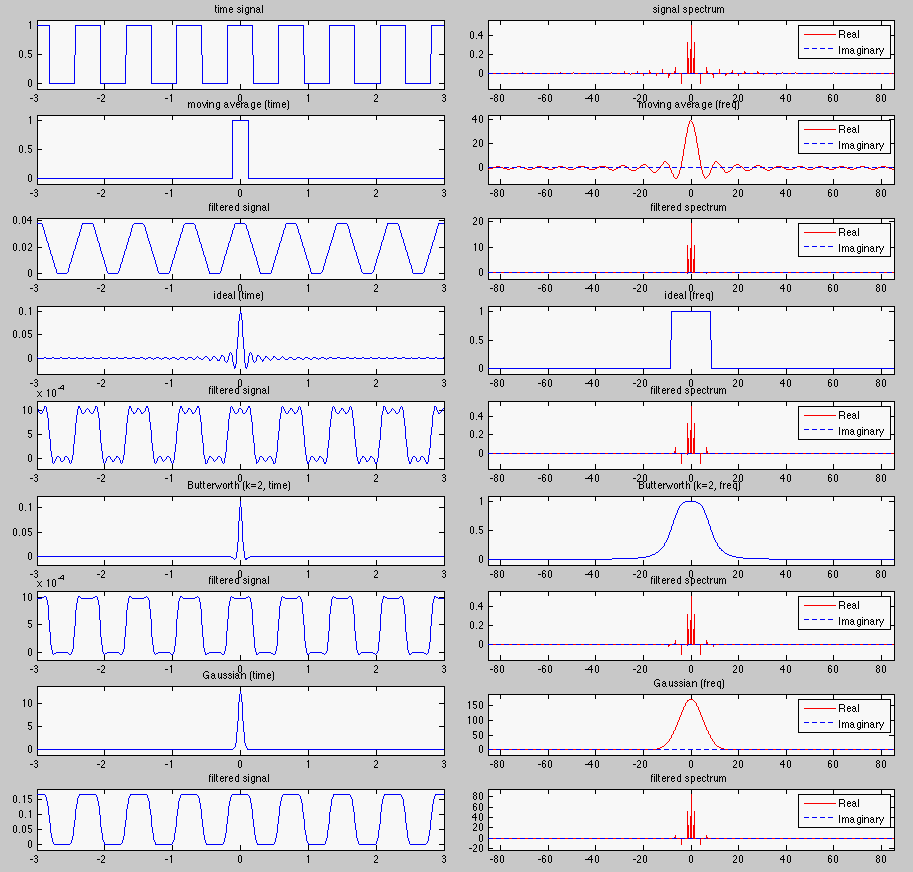
This figure shows 1-D low-pass filters in both time (left) and frequency (right) domains.
A signal  , a square impulse train, and its spectrum
  are shown in the top
row. Following that there are four pairs of plots showing each of the four types of
filters and their filtering effects. The filters are given as both the impulse response
function
  in time domain and its spectrum, the frequency response function,
  in frequency domain. The filtering process is a convolution
 in time
domain(left) and a multiplication
  in frequency domains (right).
- Moving average: the signal is convolved with a square window in time domain,
or its spectrum is multiplied by a sinc function in frequency domain.
- Ideal low-pass filter: The signal spectrum is multiplied by an ideal
low-pass filter in frequency domain, the signal is convolved with a sinc window.
Note the ringing effect.
- Butterworth filter: The signal spectrum is multiplied by a Butterworth low-pass
filter smoother than the ideal filter, the signal is convolved with a smoother window.
Now the ringing effect is reduced.
- Gaussian filter: The signal spectrum is multiplied by a smooth Gaussian low-pass
filter, the signal is convolved with a smooth Gaussian window. Consequently the ringing
effect has totally disappeared.
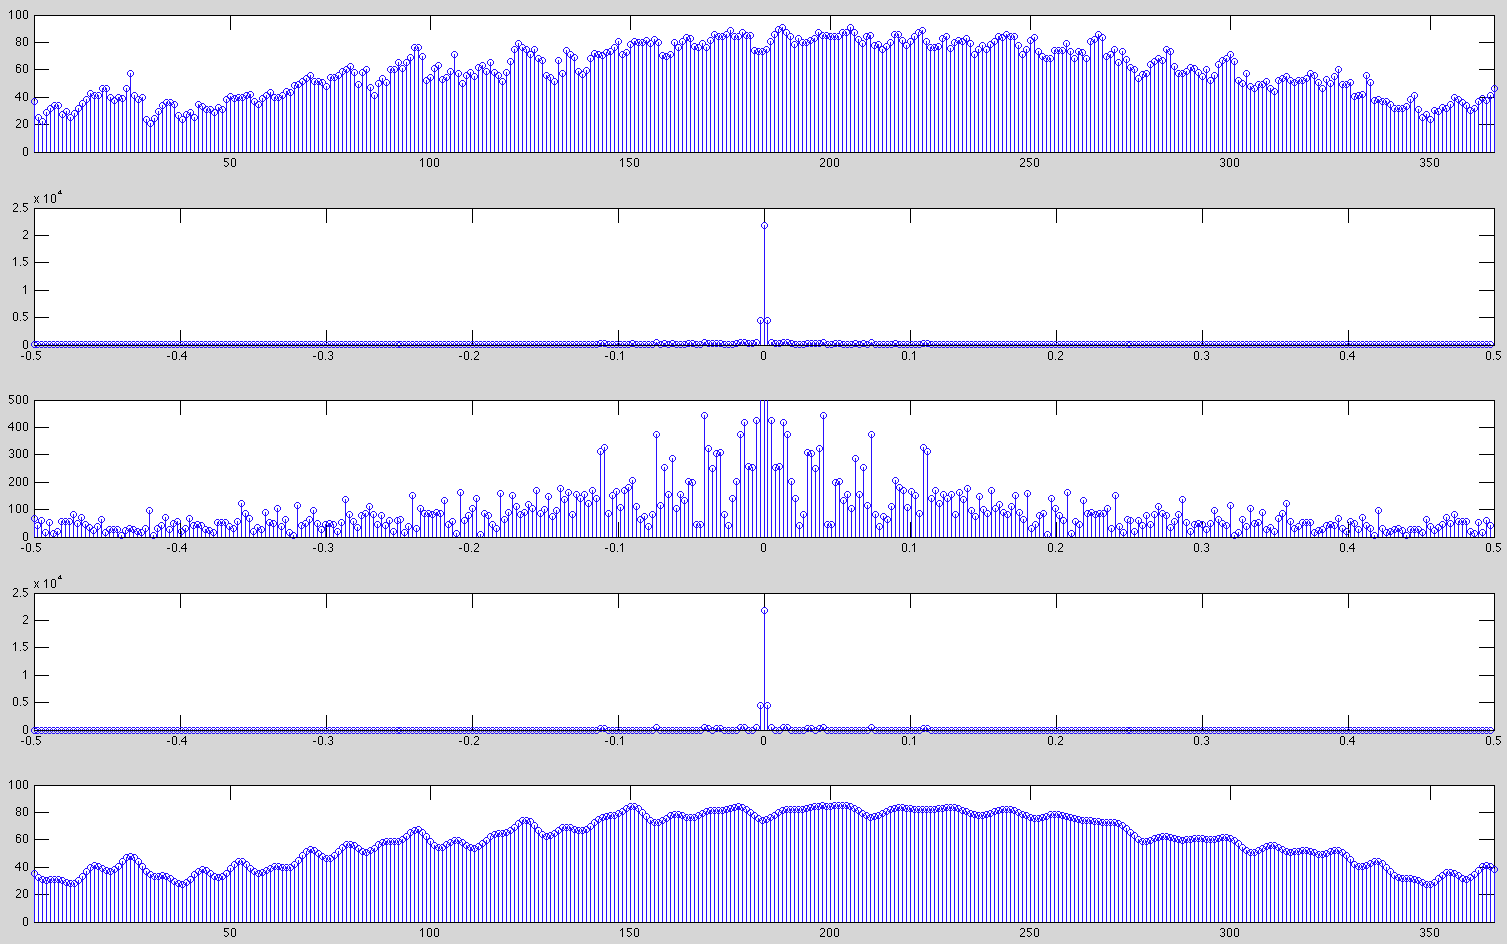
From top to bottom:
- Daily temperature in Los Angeles, 2010
- The spectrum (magnitude only)
- Frequency components of lower magnitudes
- Modified spectrum with 94 percent of the components suppressed to zero
- Reconstructed time signal with 6 percent of the components carrying 99 percent energy


Next: Fourier Filtering 2D
Up: fourier
Previous: Spectrum Centralization
Ruye Wang
2015-11-12


![]() , a square impulse train, and its spectrum
, a square impulse train, and its spectrum ![]() are shown in the top
row. Following that there are four pairs of plots showing each of the four types of
filters and their filtering effects. The filters are given as both the impulse response
function
are shown in the top
row. Following that there are four pairs of plots showing each of the four types of
filters and their filtering effects. The filters are given as both the impulse response
function ![]() in time domain and its spectrum, the frequency response function,
in time domain and its spectrum, the frequency response function, ![]() in frequency domain. The filtering process is a convolution
in frequency domain. The filtering process is a convolution
![]() in time
domain(left) and a multiplication
in time
domain(left) and a multiplication ![]() in frequency domains (right).
in frequency domains (right).
