To transform the gray levels of the image so that the histogram of the
resulting image is equalized to become a constant:
The purposes:
We first assume the pixel values are continuous in the range of ![]() , and
the mapping function
, and
the mapping function ![]() maps
maps ![]() to
to ![]() also in the same range. We
also assume all pixels within the gray scale interval
also in the same range. We
also assume all pixels within the gray scale interval ![]() of the input image
are mapped to the corresponding range
of the input image
are mapped to the corresponding range ![]() of the output image. As the number
of pixels being mapped remains unchanged, we have
of the output image. As the number
of pixels being mapped remains unchanged, we have
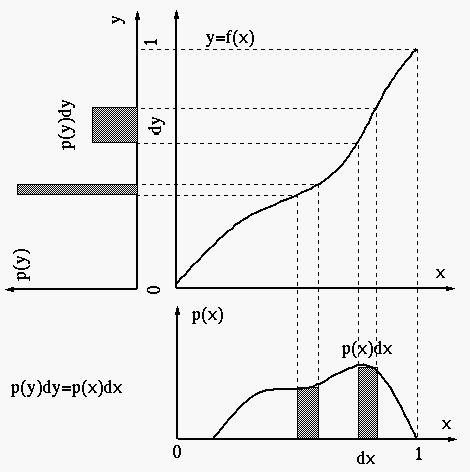
For the histogram of the output image to be equalized, it needs to be
constant 1, i.e., ![]() , so that
, so that
This histogram equalization mapping can be intuitively interpreted by the following:
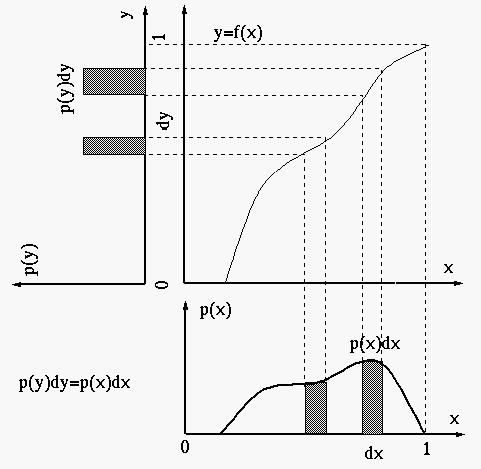
For discrete gray levels, the gray level of the input ![]() takes one of
the
takes one of
the ![]() discrete values:
discrete values: ![]() , and the continuous mapping function
becomes discrete:
, and the continuous mapping function
becomes discrete:
![\begin{displaymath}
y'[j]=H_x[j]\stackrel{\triangle}{=}\sum_{i=0}^j h_x[i]
\end{displaymath}](img58.png)
![\begin{displaymath}
h_x[i]=\frac{n_i}{\sum_{i=0}^{L-1} n_i}=\frac{n_i}{N},\;\;\;\;\;\;\;
\sum_{i=0}^{L-1} h_x[i]=1
\end{displaymath}](img61.png)
The resulting function ![]() in the range
in the range
![]() needs to be
converted to the gray levels
needs to be
converted to the gray levels ![]() by either of the two ways:
by either of the two ways:

Example:
Assume the images have
![]() pixels in
pixels in ![]() gray levels.
The following table shows the equalization process corresponding to the
two conversion methods above:
gray levels.
The following table shows the equalization process corresponding to the
two conversion methods above:
| 0 | 790 | 0.19 | 0.19 |
|
0.19 | 0.19 | 0 | 0.19 | 0.19 |
| 1 | 1023 | 0.25 | 0.44 |
|
0.25 | 0.44 | 2 | 0.25 | 0.44 |
| 2 | 850 | 0.21 | 0.65 |
|
0.21 | 0.65 | 4 | 0.21 | 0.65 |
| 3 | 656 | 0.16 | 0.81 |
|
5 | 0.16 | 0.81 | ||
| 4 | 329 | 0.08 | 0.89 |
|
0.24 | 0.89 | 6 | 0.08 | 0.89 |
| 5 | 245 | 0.06 | 0.95 |
|
7 | ||||
| 6 | 122 | 0.03 | 0.98 |
|
7 | ||||
| 7 | 81 | 0.02 | 1.00 |
|
0.11 | 1.00 | 7 | 0.11 | 1.00 |
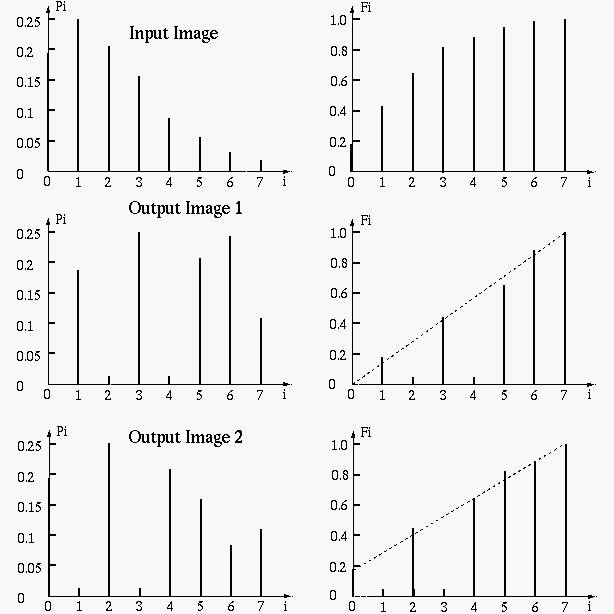
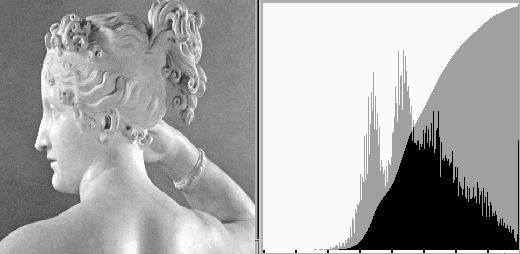
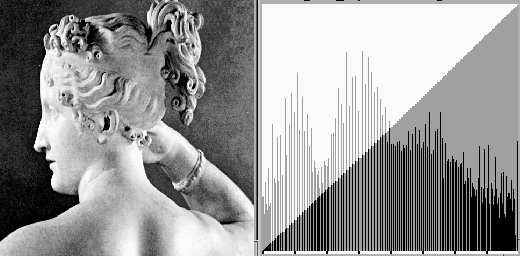
In the following example, the histogram of a given image is equalized. Although the resulting histogram may not look constant, but the cumulative histogram is a exact linear ramp indicating that the density histogram is indeed equalized. The density histogram is not guaranteed to be a constant because the pixels of the same gray level cannot be separated to satisfy a constant distribution.
Programming issues:
![\begin{displaymath}
\par
d=1.0/M/N;
\par
for (i=0; \;\;i<256;\;\;i++)\; \;h[i]=0...
...\;\;n<N;\;\;n++)
\par
\;\;\;\;\;\;\;h[x[m][n]]=h[x[m][n]]+d;
\end{displaymath}](img92.png)
![\begin{displaymath}
\par
sum=0.0;
\par
for (i=0;\;\;i<256;\;\;i++)\;\;\{
\par
\;\;\;\;sum=sum+h[i];
\par
\;\;\;\;lookup[i]=sum*255;
\par
\}
\par
\end{displaymath}](img93.png)
![\begin{displaymath}
\par
for (m=0; \;\;m<M;\;\;m++)
\par
\;\;\;for (n=0; \;\;n<N;\;\;n++)
\par
\;\;\;\;\;\;y[m][n]=lookup[x[m][n]];
\par
\end{displaymath}](img94.png)
Example:
