Use the
Type 575 semiconductor curve tracer
in the electronic lab to test
2N3904
transistors in common emitter mode.
Observe and take pictures of both the input and output characteristic plots.
Important note: To make sure you do not burn your transistor,
(a) study the datasheet of the transistor to determine the leads for E, B and C,
(b) do not apply  voltage higher than 30 V.
Initial settings before you start:
- Display control (top-right)
- Adjust both the vertical and horizontal zero positions for
the light spot to be at the lower-left corner of the grids;
- Vertical axis (for
 or
or  ): 0.5 or 1 mA/Div;
- Horizontal axis (
 or “base voltage”): 0.1 or 0.5 V/Div;
- Horizontal axis (
 or “collector voltage”): 2 V/Div.
- Collector voltage (lower-left)
- Peak voltage range: x1 (be careful to use x10 as maximum voltage is 200 V!)
- Polarity: + for npn transistors
- Peak Volt (): 10 to 20 Volts
- Dissipation limiting resistor (
 ): 1 k
- Base voltage (lower-right)
- Repetitive/Single scan: single for input characteristic plot,
repetitive for output characteristic plot
- Steps/family: 12
- Polarity: + for npn transistors
- Steps/Sec: 240
- Series resistor (
 ) (no relevance here)
- Step selection:
What to observe:
- The input characteristics (confirm
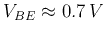 when
when
 is in the range of 1 to 10 mA.)
- The output characteristics, observe specifically:
- how the load line changes when is changed;
- how the load line changes when is changed;
- find
 for different transistors.
( is represented by the vertical axis (mA/Div) and is
represented by the steps (mA/step).)
for different transistors.
( is represented by the vertical axis (mA/Div) and is
represented by the steps (mA/step).)
What to submit:
- Take screenshots of both the input and output characteristic plots
observed on the semiconductor curve tracer with the following clear
labeled (with meaningful increment):
- The voltage (horizontal axis) or
- The current (vertical axis) or
- For the output plot, each one of the 12 values in the family
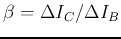
- Determine the value
 (also referred to as the
“forward transfer current ratio” and denoted by
(also referred to as the
“forward transfer current ratio” and denoted by  or
or  on
the 2N3904 datasheet
(also see class notes)
from the output plot.
on
the 2N3904 datasheet
(also see class notes)
from the output plot.
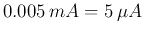
- Determine from the input plot when is within the range of
0.01 to 0.1 mA, i.e., is within the range of
 to
to  .
.
- Describe how the load line changes in the output plot when and
are increased or decreased.