

Next: Linear System Theory and
Up: The retina
Previous: Neural circuits in the
The ganglion cells respond to grating stimuli (sinusoidal or square patterns
of alternating bright and dark bars) of specific spatial frequency. This is
the result of their antagonistic center-surround RF structure.
Sinusoidal gratings of different spatial frequencies are often used as the
testing stimuli in physiological studies. One reaons for using sinusoidal
signal is due to the Fourier theory which basically states that an arbitrary
signal can be decompsed into a series of sin and cos functions of different
magnitudes and phases. If the visual system under study can be assumed to be
linear, then its response to an arbitrary signal can be obtained from its
responses to sinusoidal signals.
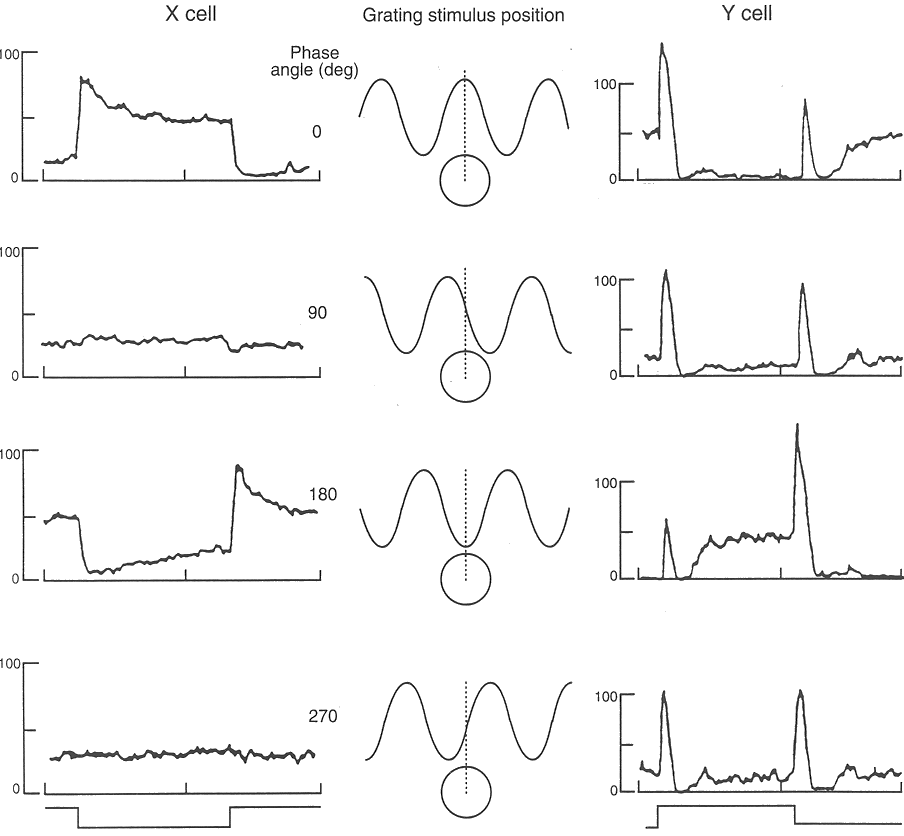
Enroth-Cugel and Robson (1966) found two different types of ganglion cells in
cat useing grating signals.
- X type ganglion cells behave linearly as they respond to both the
frequency and phase of the sinusoidal gratings. When the frequency is
such that the width of the bright bar is about the same as the diameter of the
on-center of the RF, an X-type ganglion cell may respond most differently from
its resting state (responding to uniform lights over the entire RF), in one of
the following three ways, depending on the phase:
- Maximum positive response if the bright bar covers the on center and the
two neighboring dark bars cover the off surround;
- Null response when the signal is shifted by 90 or 270 degrees in phase,
i.e., the bright or dark bar covers half of the on center and a neighboring
dark or bright bar cover the other half;
- Maximum negative response when the signal is shifted by 180 degrees in phase,
i.e., the dark bar covers the on center and the two neighboring bright bars
cover the off surround.
When the spatial frequency of the signal is either higher or lower than this particular,
the magnitude (both positive and negative) of the response will be reduced. As we consider
the absolute or squared difference between the response to a grating and the resting
state as the output signal, the response of the X cells as a function of the spatial
frequency is a curve (tuning curve) that peaks at an optimal frequency.
An X-type cell demonstrates the linearity of spatial summation as its output is the sum
of all inputs over its entire RF waited by its sensitivity as a function of space.
- Y type ganglion cells are different from the X type in several aspects:
- While still tuned to frequency, a Y cell is less sensitive to phase. Especailly
at high frequencies; It shows nonlinearity in spatial summation;
- The RF of a Y cell is about three times larger than that of an X cell;
- The Y cells' responses are more transient while X cells have both transient and
mantained components;
- Y cells are more sensitive to visual motions than X cells;
- There are more X cells than Y cells.
We can see that the X- and Y-type cells in cat are in some respects parallel to the
P- and M-type cells in monkey. But of course cat and monkey are very different, for
example, cats only have very limited color vision.


Next: Linear System Theory and
Up: The retina
Previous: Neural circuits in the
Ruye Wang
1999-11-06

