

Next: Response of Population of
Up: The retina
Previous: Modeling RF of Retina
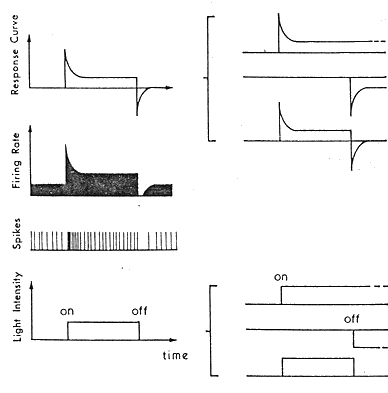
Next we model the RF in the time domain. The response r(t) of the midget
ganglion cells to a step input defined as
has both the transient and the maintained parts and can be modeled by
r(t)=T[ s(t) ]=h(t)=[km + kt exp(-at)]u(t)
where km and kt are, respectively, the magnitudes of the maintained and
transient components, a is a parameter that determines how fast the transient
response diminishes, and u(t) is a unit step function.
A simmple impulse stimulus, a light with constant intensity (e.g., 1 for
simplicity) which is turned on at time moment t=t1 and off at t-t2can be represented by two step functions:
s(t)=u(t-t1)-u(t-t2)
Approximating the RF as a linear system and apply superposition, the response
to this stimulus is
r(t)=T[ s(t) ]=T[ u(t-t1)]-T[u(t-t2)]
as shown in this figure:

Combining both the spatail and temporal aspects, the RF can be modeled by its
response to a unit step input over the entire RF:
Note that here h(t) is the temporal response to a step function u(t),
instead of the usual impulse function  .
Since this spatiotemporal
response function is a product of spatial response f(x,y) and temporal
response r(t), we see that the spatial and temporal aspects of the RF can
be separated. However, this separability no longer hold in some cortical
cells as we will when we discuss modeling motion sensitive cells in the visual
cortex.
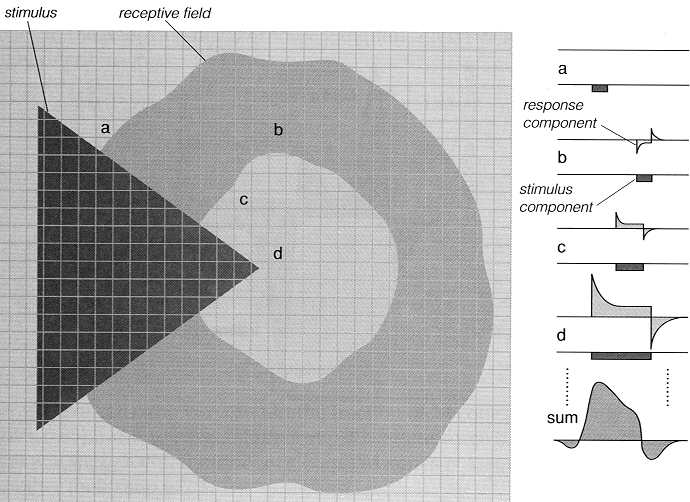
Given the spatiotemporal desription f(x,y,t) of the RF of a ganglion cell,
its temporal response to a certain stimulus s(x,y,t) can be computed and
then compared to the experimental result:
An example is shown in this figure:


Next: Response of Population of
Up: The retina
Previous: Modeling RF of Retina
Ruye Wang
1999-11-06


