This method treats motion detection as a filtering process g=h*f, where
f=f(x,y,t) is the visual signal,
h=h(x,y,t) is the impulse response of a
motion detector. For a translational motion the sigmal can be written as
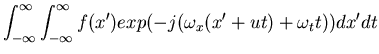 |
|||
| = | ![$\displaystyle \int_{-\infty}^{\infty} [ \int_{-\infty}^{\infty} f(x') exp(-j(\omega_x x')) dx'] exp(-j(\omega_x u+\omega_t)t) dt$](img72.gif) |
||
| = |
The response function h(x,y,t) is commonly modeled by the Gabor function
which is also spatiotemporally oriented. This function can be considered as a
local sinusoidal function, formed by modulating a sinusoidal function by a
Gaussian function in both spatial and temporal domains (for mathematical
convenience, the sinusoidal function is represented by the real part of the
corresponding exponential function):
| = | ![$\displaystyle h_0\,exp[j(\Omega_x x+\Omega_y y)]\,exp\left[(-\frac{x^2+y^2}{2\sigma_s^2})
\right]\,exp[j(\Omega_t t)] exp\left[(-\frac{t^2}{2\sigma_t^2})\right]$](img78.gif) |
||
| = | ![$\displaystyle h_0\,exp\left[-\frac{x^2+y^2}{2\sigma_s^2}-\frac{t^2}{2\sigma_t^2...
...Omega_s}\;x+\frac{\Omega_y}{\Omega_s}\;y
+\frac{\Omega_t}{\Omega_s}\;t) \right]$](img79.gif) |
||
| = | ![$\displaystyle h_0\,exp\left[-\frac{x^2+y^2}{2\sigma_s^2}-\frac{t^2}{2\sigma_t^2}
\right] exp[ j\Omega_s (cos\,\theta\;x+sin\,\theta\;y+V t)]$](img80.gif) |
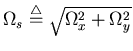
Here ![]() ,
,
![]() ,
,
![]() ,
,
![]() and h0 are parameters
representing different response characteristics of a given cell (the local motion
detector). Specifically, h0 is the magnitude of the response,
and h0 are parameters
representing different response characteristics of a given cell (the local motion
detector). Specifically, h0 is the magnitude of the response,
 is the preferred
spatial frequency,
is the preferred
spatial frequency,
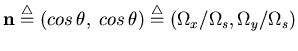 is the preferred
direciton, and
is the preferred
direciton, and
 is the preferred
speed of the visual stimuli. And
is the preferred
speed of the visual stimuli. And ![]() and
and ![]() represent the size of the
receptive field and the duration of the response in time, respectively. In the
frequency domain the iso-surfaces of this function are parallel ellipsoidal shapes
in the 3-dimensional frequency space
represent the size of the
receptive field and the duration of the response in time, respectively. In the
frequency domain the iso-surfaces of this function are parallel ellipsoidal shapes
in the 3-dimensional frequency space
![]() .
The orientations
of these ellipsoids represent the tuning of the cell's response to spatial frequency,
temporal frequency, direction and speed of the visual signal. The strength of the
response of a given cell to a signal f depends on whether and how much the
orientations of the signal and the impulse response h coincide in the 3-dimensional
frequency domain. When the two orientations coincide with maximum overlap, strongest
response is obtained. As the angle between the two orientations is getting larger
the response will be getting weaker, until the two orientations are perpendicular to
each other with minimum overlap, weakest (or no response) is obtained. These different
response strengths can be estimated by a Gaussian function with various attributes of
the visual signal as the variables. More detailed discussion of this model can be
found in [30], [31], and the
neurophysiological support of the model can be found in [32],
[33], and citemclean1989.
.
The orientations
of these ellipsoids represent the tuning of the cell's response to spatial frequency,
temporal frequency, direction and speed of the visual signal. The strength of the
response of a given cell to a signal f depends on whether and how much the
orientations of the signal and the impulse response h coincide in the 3-dimensional
frequency domain. When the two orientations coincide with maximum overlap, strongest
response is obtained. As the angle between the two orientations is getting larger
the response will be getting weaker, until the two orientations are perpendicular to
each other with minimum overlap, weakest (or no response) is obtained. These different
response strengths can be estimated by a Gaussian function with various attributes of
the visual signal as the variables. More detailed discussion of this model can be
found in [30], [31], and the
neurophysiological support of the model can be found in [32],
[33], and citemclean1989.
Although this spatiotemporal energy model may look quite different from the correlation model, the two models are equivalent mathematically. In fact, they both belong to a broad class of models called second order model. The name comes from the fact that there is always the nonlinearity caused by either the multiplication of two signals from two channels as in the correlation model, or the squaring operation as in this energy model.
Various implementations (some even with certain biological plausibility) of these basic methods described in this section have been proposed to model the visual processing in the biological system. But still little is known about how the real neurons in V1 actually respond selectively to the visual attributes related to motion, such as spatiotemporal frequency, motion speed and direction.