

Next: The Color Space
Up: Trichromatic Theory Revisited
Previous: Spectral matching curves
As an example, we want to find the spectral matching curves using a particular
set of primaries composed of monochromatic (spectral) red, green blue, as
recommended by the Commission Internationale de l'Eclairage (CIE):
- Red:
 , where
5
  nm;
nm;
- Green:
 , where
 nm;
nm;
- Blue:
 , where
 nm.
nm.
and the CIE reference white defined by a flat spectral distribution:
To find the spectral matching curves, we first find  , the response of
the ith type of cones to the jth primary:
We next find the weights  to match the CIE reference white by solving
the color matching equations for the reference white
where  , as noted before.
Now we substitute these 
 and
and
 into
the matching equations for a spectral color
 to get
Solving these equations we get
 for any
wavelength
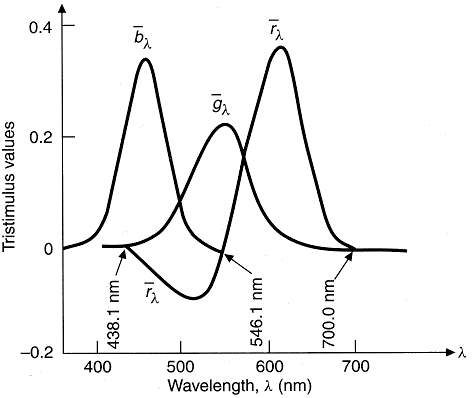
  , i.e., the three spectral matching curves representing
the amount of each of the spectral red, green and blue needed to match each
spectral color, as shown in the plot. Note that the interpretation of the
negative values for spectral red at certain wavelengths
(
 ) is the same as discussed before. Namely,
spectral colors of wavelength in this range should be mixed with the spectral
red to be matched with the mixture of the spectral green and spectral blue.


Next: The Color Space
Up: Trichromatic Theory Revisited
Previous: Spectral matching curves
Ruye Wang
2013-09-25
![]() , the response of
the ith type of cones to the jth primary:
, the response of
the ith type of cones to the jth primary:

![]()
![]() and
and
![]() into
the matching equations for a spectral color
into
the matching equations for a spectral color
![]() to get
to get

