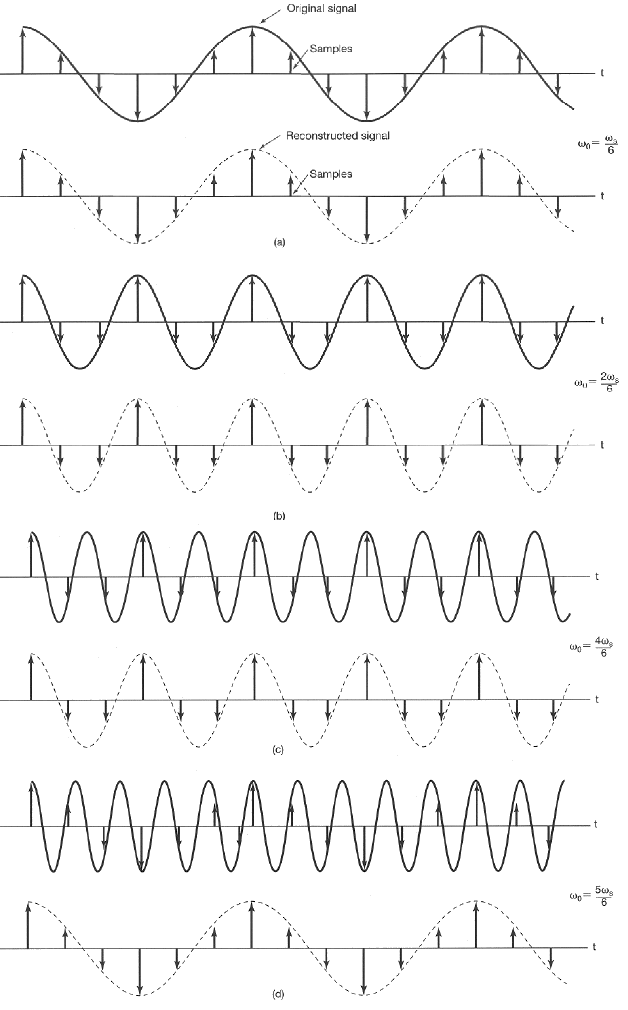
To demonstrate the sampling theorem, the figure below shows the sampling of sinusoidal signals of various frequencies. As can be seen, when the frequency is higher than half of the sampling rate, aliasing occurs.

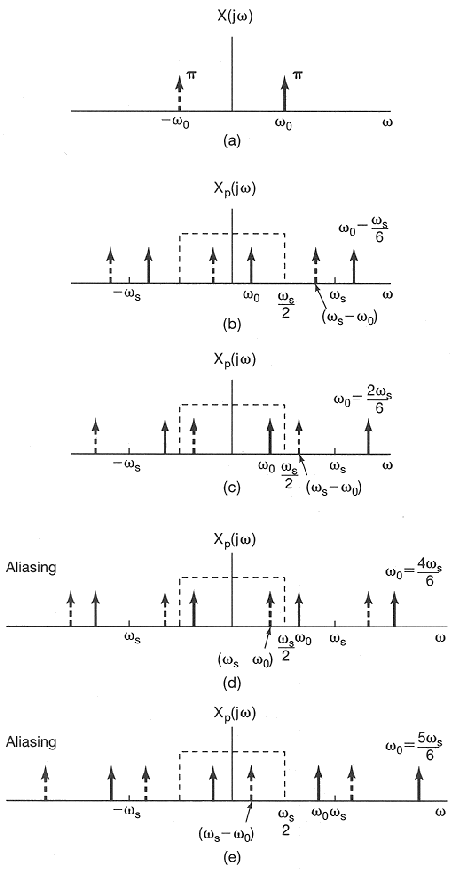
The same sampling process can be further illustrated in the frequency domain
as shown in the figure below. The spectrum of the sinusoidal signal
![]() is
is
![]() ,
containing two
delta impulses at
,
containing two
delta impulses at
![]() on either side of the origin, as shown
in (a).
on either side of the origin, as shown
in (a).
To sample the signal, x(t) is multiplied by a comb p(t) in time domain, or
equivalently, its spectrum ![]() is convolved with
is convolved with ![]() to become
to become
![]() ,
as shown in (b). Note that the period of
,
as shown in (b). Note that the period of
![]() equals to the sampling frequency
equals to the sampling frequency
![]() ,
and the
convolution has infinite copies of
,
and the
convolution has infinite copies of ![]() (the two delta impulses)
separated by distance
(the two delta impulses)
separated by distance ![]() .
.
In (b) and (c),
![]() ,
i.e., the original copy of
,
i.e., the original copy of
![]() is inside the window of the ideal lowpass filter (with cut-off
frequency
is inside the window of the ideal lowpass filter (with cut-off
frequency
![]() )
which can perfectly reconstruct the original signal
x(t) from its samples.
)
which can perfectly reconstruct the original signal
x(t) from its samples.
In (d) and (e),
![]() ,
i.e., the original copy of
,
i.e., the original copy of ![]() is outside the window of the ideal lowpass filter. Instead, the lowpass filter
will catch the copies of
is outside the window of the ideal lowpass filter. Instead, the lowpass filter
will catch the copies of ![]() in the next higher frequency range (both
positive and negative). In the case, the reconstructed signal by lowpass
filtering will appear to be at frequency
in the next higher frequency range (both
positive and negative). In the case, the reconstructed signal by lowpass
filtering will appear to be at frequency
![]() (represented by
the impulses inside the window of the ideal filter), which is lower than the
actual frequency
(represented by
the impulses inside the window of the ideal filter), which is lower than the
actual frequency ![]() ,
i.e., aliasing occurs.
,
i.e., aliasing occurs.

The sampling of a sinusoidal function is illustrated in this web demo