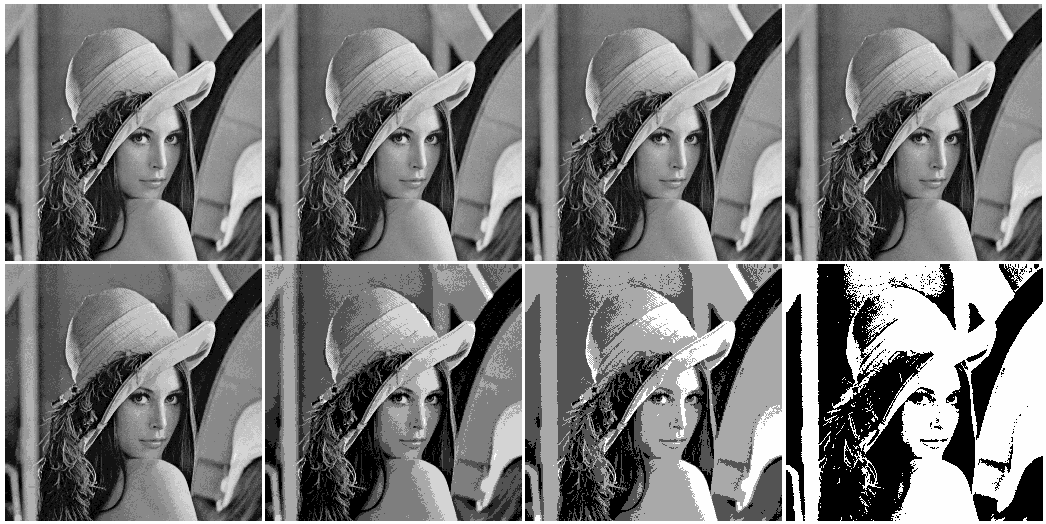
Next: Spatial sampling Up: Image Digitization Previous: Image Digitization
The continuous range of light intensity


Define 
 |
(1) |
 . And define the
  discrete gray
levels to represent the L intervals:
 |
(2) |
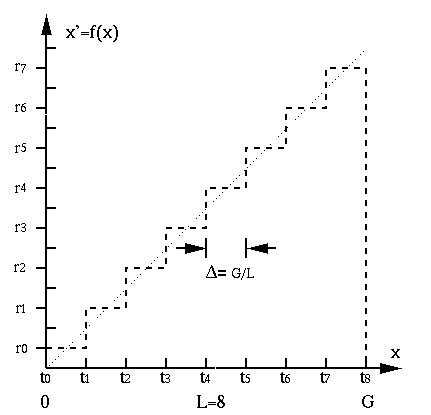
Then the quantization can be defined as a function
 iff iff |
(3) |

Define mean square error of the quantization process as
![$\displaystyle {\cal E} = E[ (x-x')^2]=\int_{-\infty}^\infty (x-x')^2 p(x)dx=
\sum_{i=0}^{L-1} \int_{t_i}^{t_{i+1}} (x-r_i)^2 p(x)dx$](img12.svg) |
(4) |
 is distribution of input intensify
  . The optimal quantization
in terms of
  and
and  can be found by minimizing
  , by solving
 |
(5) |
 to be known. The previous quantization is optimal when
 is a uniform distribution. When
  is not uniform, more gray levels
will be assigned to the gray scale regions corresponding to higher
  .
.
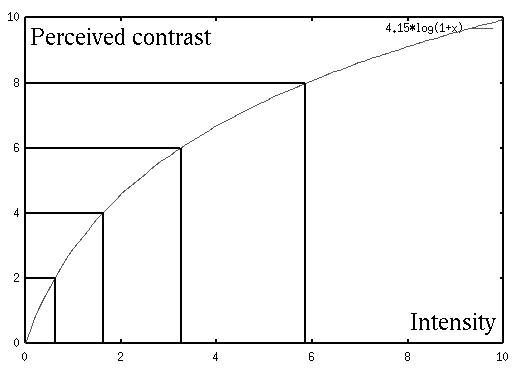
The perceived contrast is a function of the intensity. Specifically, we perceive the same contrast between the object and its surrounding if
 |
(6) |
 is the intensity and
 is the intensity
difference, the absolute contrast (Weber's law). For example,
 |
(7) |
 at a high absolute intensity
 is perceived the same as a much lower contrast of
 at a low absolute intensity
  . In other words„ we are less sensitive to
contrast when the intensity
  is high. As another example, consider the
perceived brightness of a 3-way light bulb with 50, 100 and 150 Watts (with
the assumption that the brightness is proportional to the power consumption).
The perceived contrast between 50 and 100 is higher than that between 100 and
150 as
 . Consequently, the perceived contrast can
be defined as a logarithmic function of the intensity:
 |
(8) |

Weber's law describes a general phenominon in human perception. Another
example is the difference between different sound frequencies. The difference
between 


In the image acquisition process, nonlinear mapping may occur in various
stages. For example, in the camera system, the in-coming light intensity
may be nonlinearly mapped to the film or digital recording sensors, in the
cathode ray tube (CRT), the applied voltage may be nonlinearly mapped to
the brightness of the CRT display, and in the biological visual system, the
in-coming light intensity is nonlinearly perceived by retina and the visual
cortex of the brain. The goal of
gamma correction
is to compensate for all such nonlinear mappings, the
following power function that relates the input 

 |
(9) |
 . Here
  is a constant scaling factor, and
  is
a parameter that characterizes the nonlinearity. Obviously when
  ,
,
 is linearly related to
  . Otherwise, we have a nonlinear mapping. As
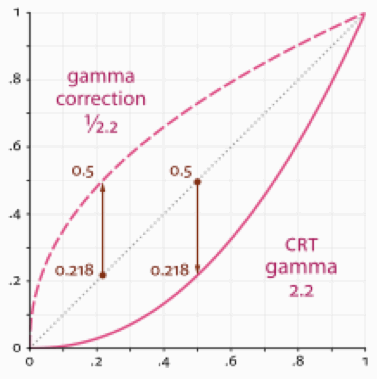
an example, the nonlinear CRT mapping modeled by
 can be
corrected by another nonlinear mapping
 ,
as shown below:
