Next: About this document ... Up: contrastTransform Previous: Histogram Equalization
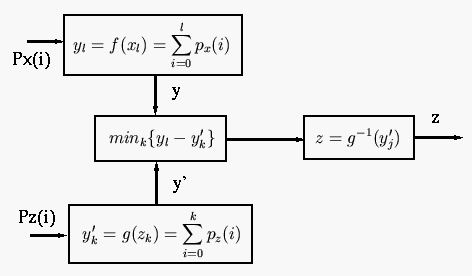
Here we want to convert the image so that it has a particular histogram that can be arbitrarily specified. Such a mapping function can be found in three steps:
We first equalize the histogram 

 |
(17) |
We then equalize the desired histogram 

 |
(18) |
The inverse of the above transform is
 |
(19) |
 and
and  both have the same
equalized histogram, they are actually the same image, i.e.,
 , and the overall transform from the given image
  to
the desired image
  can be found to be:
 |
(20) |
![$h_y[i]$](img81.svg) and
and ![$h_{y'}[i]$](img82.svg) are not necessarily identical.
We therefore need to relate each gray level in
are not necessarily identical.
We therefore need to relate each gray level in  with
with
![$h_x[i]\ne 0$](img83.svg) to a gray level in
to a gray level in  with
with
![$h_z[j]\ne 0$](img84.svg) , so
that the mapping from
, so
that the mapping from  to
to  can be established.

Here are the specific steps of the algorithm:
 , and find its cumulative
 , the histogram equalization mapping function:
![$\displaystyle H_x[j]=\sum_{i=0}^j h_x[i]$](img87.svg) |
(21) |
 , and find its cumulative
 , the histogram equalization mapping function:
![$\displaystyle H_z[j]=\sum_{i=0}^j h_z[i]$](img90.svg) |
(22) |
 , find an output level
  so that
 ![$H_z[j]$](img92.svg) best
matches
best
matches ![$H_x[i]$](img93.svg) :
:
![$\displaystyle \vert H_x[i]-H_z[j] \vert = min_k \vert H_x[i]-H_z[k] \vert$](img94.svg) |
(23) |
![$lookup[i]=j$](img95.svg) .
.
Example:
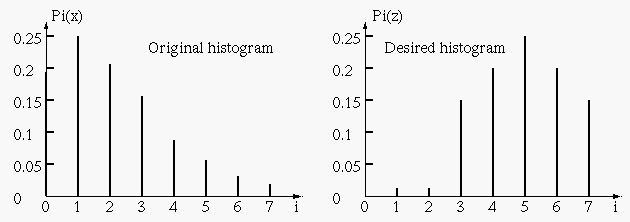
The histogram of the given image and the histogram desired are shown below:

 to get mapping
  (save as previous example).
 |
 |
 |
 |
| 0 | 790 | 0.19 | 0.19 |
| 1 | 1023 | 0.25 | 0.44 |
| 2 | 850 | 0.21 | 0.65 |
| 3 | 656 | 0.16 | 0.81 |
| 4 | 329 | 0.08 | 0.89 |
| 5 | 245 | 0.06 | 0.95 |
| 6 | 122 | 0.03 | 0.98 |
| 7 | 81 | 0.02 | 1.00 |
 to get mapping
  .
.
 |
 |
 |
| 0 | 0.0 | 0.0 |
| 1 | 0.0 | 0.0 |
| 2 | 0.0 | 0.0 |
| 3 | 0.15 | 0.15 |
| 4 | 0.20 | 0.35 |
| 5 | 0.30 | 0.65 |
| 6 | 0.20 | 0.85 |
| 7 | 0.15 | 1.0 |

 |
 |
 |
 |
| 0 | 0.19 | 0.0 | 3 |
| 1 | 0.44 | 0.0 | 4 |
| 2 | 0.65 | 0.0 | 5 |
| 3 | 0.81 | 0.15 | 6 |
| 4 | 0.89 | 0.35 | 6 |
| 5 | 0.95 | 0.65 | 7 |
| 6 | 0.98 | 0.85 | 7 |
| 7 | 1.0 | 1.0 | 7 |
Here is the look-up table:
| i | 0 | 1 | 2 | 3 | 4 | 5 | 6 | 7 |
| j | 3 | 4 | 5 | 6 | 6 | 7 | 7 | 7 |
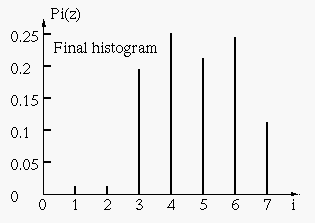
This is the histogram of the resulting image:

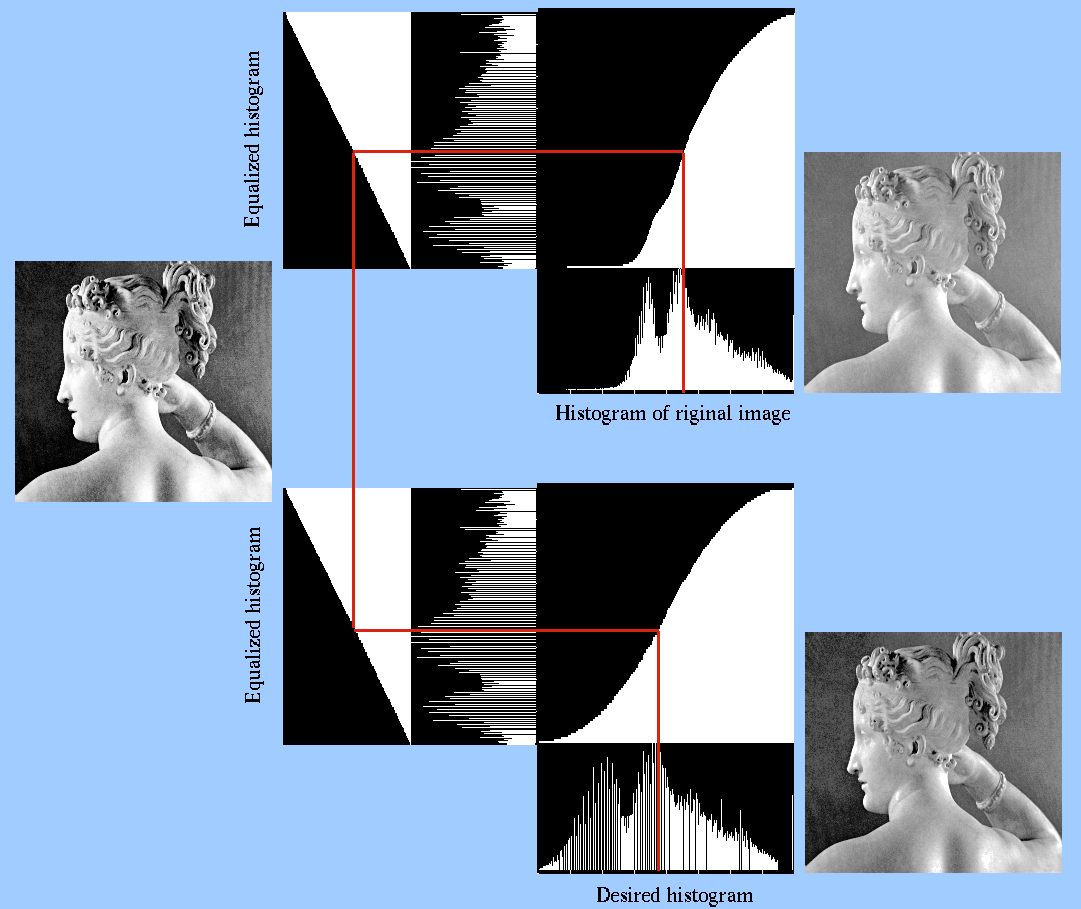
In the following example, the desired histogram is a triangle with linear increasing slope in the lower half of the the gray level range, and linear decreasing slope in the upper half. Again the cumulative histogram shows indeed the density histogram is such a triangle, i.e., its derivative is the desired triangle.
