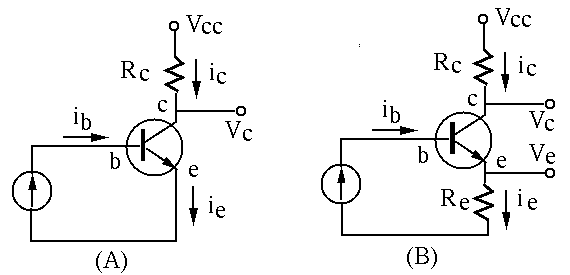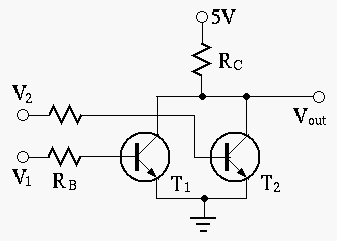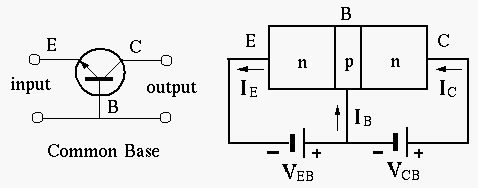
- If it is known that
 and
and  , find
  and
and  .
.
- If
 and
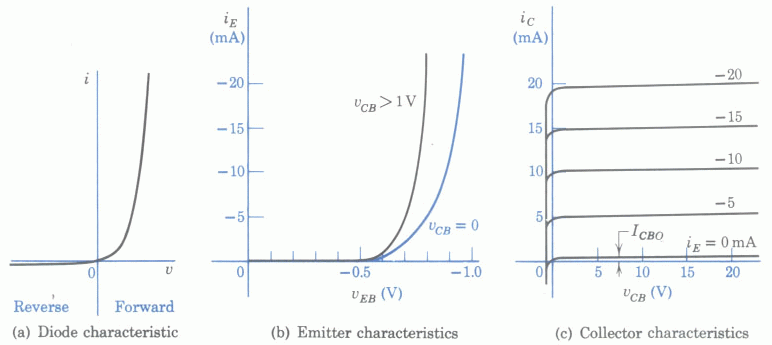
and  , estimate
  ,
,  and
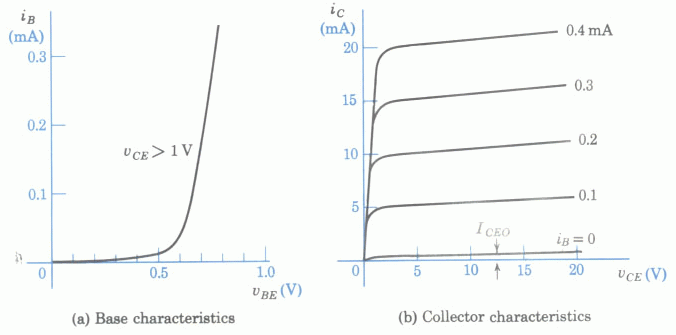
and  based on the plots below. Re-estimate these currents if
  is
increased to
  .
.
Note: in the figure above, as the assumed polarities of both
 and
and
 are the opposite to those assumed in plot (b) below, the negative
signs for both
  and
and  in the plot should be dropped.
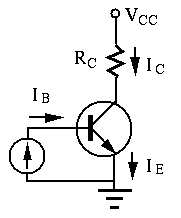
- The base current is
 .
Find
  and
and  as functions of time.
- Repeat the above for
 .
.
- Repeat the above for
 .
However, note that the actual base current cannot be negative as
it can only flow from base to emitter but not the other direction,
i.e., all negative parts of
  are zero.
Note: As the convention in the schematics of transistor circuits,
the bottom horizontal line is treated as the ground, and all voltages,
such as ![]() ,
, ![]() and
and ![]() are measured with respect to the
ground as the reference point.
are measured with respect to the
ground as the reference point.
Hint: The relationship ![]() is only valid in the
linear region in the middle range of the load line. However, in
the cut-off region (close to the horizontal axis) and the saturation
region (close to the vertical axis), the above relationship no
longer holds and the actual output current
is only valid in the
linear region in the middle range of the load line. However, in
the cut-off region (close to the horizontal axis) and the saturation
region (close to the vertical axis), the above relationship no
longer holds and the actual output current ![]() and
and ![]() can
only be found graphically in the output characteristic plot.
can
only be found graphically in the output characteristic plot.
