Visual Perception of Luminance
where ![]() is the reflectivity of the object.
is the reflectivity of the object. ![]() represents the
objective physics of the lighting of the object.
represents the
objective physics of the lighting of the object.
The light reflected by a 3D object is projected through the lens of the visual
system (camera, eye) to become a 2D signal
![]() , which is then
detected by the sensors/receptors of the visual system:
, which is then
detected by the sensors/receptors of the visual system:
Here ![]() is the sensitivity (``luminous efficiency'') of the film, the
CCD sensors, or the photoreceptors (rods and cones) in the retina. The function
of human eye is a bell-shaped function of frequency.
is the sensitivity (``luminous efficiency'') of the film, the
CCD sensors, or the photoreceptors (rods and cones) in the retina. The function
of human eye is a bell-shaped function of frequency.
Brightness is the perception or sensation caused by the input light signal. It is a subjective and qualitative attribute of the object being observed, and it depends on the surroundings of an object as well as the luminance.
Two objects with different surroundings could have the same luminance but different brightnesses. For example, the screen of a TV set may look gray, but when it is turned on, a black object in the scene may seem darker due to the comparison with the background, e.g., some white objects in the scene.
More examples: White'sillusion and Wertheimer-Benary illusion
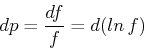
Assuming the luminance of an object is ![]() and the luminance difference
between the object and its surrounding is
and the luminance difference
between the object and its surrounding is ![]() , then according to
Weber's law,
the perceived contrast
, then according to
Weber's law,
the perceived contrast ![]() (luminance difference) between the object and its
surrounding is
(luminance difference) between the object and its
surrounding is
which indicates that at higher level ![]() , larger
, larger ![]() is needed to perceive
the same contrast at lower level
is needed to perceive
the same contrast at lower level ![]() with a smaller
with a smaller ![]() . In other wwords,
equal increment in
. In other wwords,
equal increment in ![]() , instead of in
, instead of in ![]() , is perceived to be equally
different (equal contrast).
, is perceived to be equally
different (equal contrast).
Integrating both sides, we get the perceived luminance
The constant of integration ![]() can be obtained by assuming the perceived
luminance is zero
can be obtained by assuming the perceived
luminance is zero ![]() :
:
where ![]() is the threshold luminance not perceivable. Now we have
is the threshold luminance not perceivable. Now we have

The relationship between stimulus ![]() and perception
and perception ![]() is logarithmic.
is logarithmic.
Weber's law describes a general phenominon in human perception. Another
example is the difference between different sound frequencies. The difference
between ![]() (middle C, 261.63 Hz) and
(middle C, 261.63 Hz) and ![]() (523.25 Hz) is an octave,
perceived the same as the difference between
(523.25 Hz) is an octave,
perceived the same as the difference between ![]() and
and ![]() (1046.5 Hz),
although the frequency differences between the two pairs are quite different
(261.63 Hz. vs. 523.25 Hz).
(1046.5 Hz),
although the frequency differences between the two pairs are quite different
(261.63 Hz. vs. 523.25 Hz).
Visual Perception of Colors
See here for more detailed discussion for color perception.
Along the visible wave length (350 nm - 780 nm), there are only about 128 fully saturated colors that can be distinguished.
It is the energy spectral distribution ![]() of the signal
that determines the colors we perceive.
of the signal
that determines the colors we perceive.
There exist 3 types of cells (cones) in human retina of different
response functions (luminous efficiency functions):
![]() . They overlap with each other and peak
in the yellow-green, green and blue regions, respectively.
. They overlap with each other and peak
in the yellow-green, green and blue regions, respectively.
The responses of these cells to a signal of intensity ![]() (a ``color'') are therefore
(a ``color'') are therefore
The perceived color is determined by the combination of these
3 responses
![]() . In other words, if two colors
. In other words, if two colors
![]() and
and ![]() produce the same responses:
produce the same responses:
There exist many different color models (all composed of three independent variables), for example:
It is possible for different colors, energy distributions, to produce
exactly the same visual perception in the human visual system. These colors
are said to be matched and are called metamers. Two matching colors
![]() and
and ![]() can be represented by
can be represented by
Any color can be reproduced by mixing an appropriate set of three
primary colors (e.g., CIE X, Y, Z, or red, green, and blue, not unique)
with energy distributions
![]() .
.
Suppose in order to match a given color ![]() the three primaries
need to be mixed in proportions of
the three primaries
need to be mixed in proportions of
![]() :
:
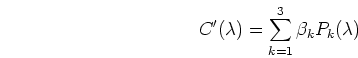
For the mixed color ![]() to be perceived the same as the given color
to be perceived the same as the given color
![]() , the responses of the three types of cone cells to
, the responses of the three types of cone cells to ![]() should be the same as those to
should be the same as those to ![]() :
:
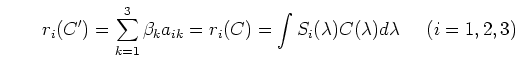
The cone cells' responses to ![]() are
are
![$\displaystyle \int S_i(\lambda)C'(\lambda) d\lambda = \int [ \sum_{k=1}^3 \beta_k P_k(\lambda) ]
S_i(\lambda) d\lambda$](img41.png) |
|||
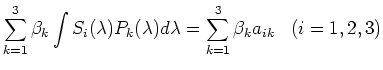 |
For ![]() to be perceived the same as
to be perceived the same as ![]() , we require
, we require
The Commission Internationale de l'Eclairage (CIE) defined three
standard primaries called X, Y, and Z. Any color
![]() can be matched using these primaries with positive
weights
can be matched using these primaries with positive
weights ![]() ,
, ![]() and
and ![]() .
.
The chromaticity values of a color is defined by its weights for
the three primaries normalized by the total energy ![]() :
:
so that ![]() . Chromaticity values depend on the hue and saturation
of the color, but are independent of the intensity.
. Chromaticity values depend on the hue and saturation
of the color, but are independent of the intensity.
All visible colors are represented by the points inside an enclosed
area in the ![]() plane. And the chromaticity diagram is the
projection of this enclosed area on
plane. And the chromaticity diagram is the
projection of this enclosed area on ![]() plane.
plane.