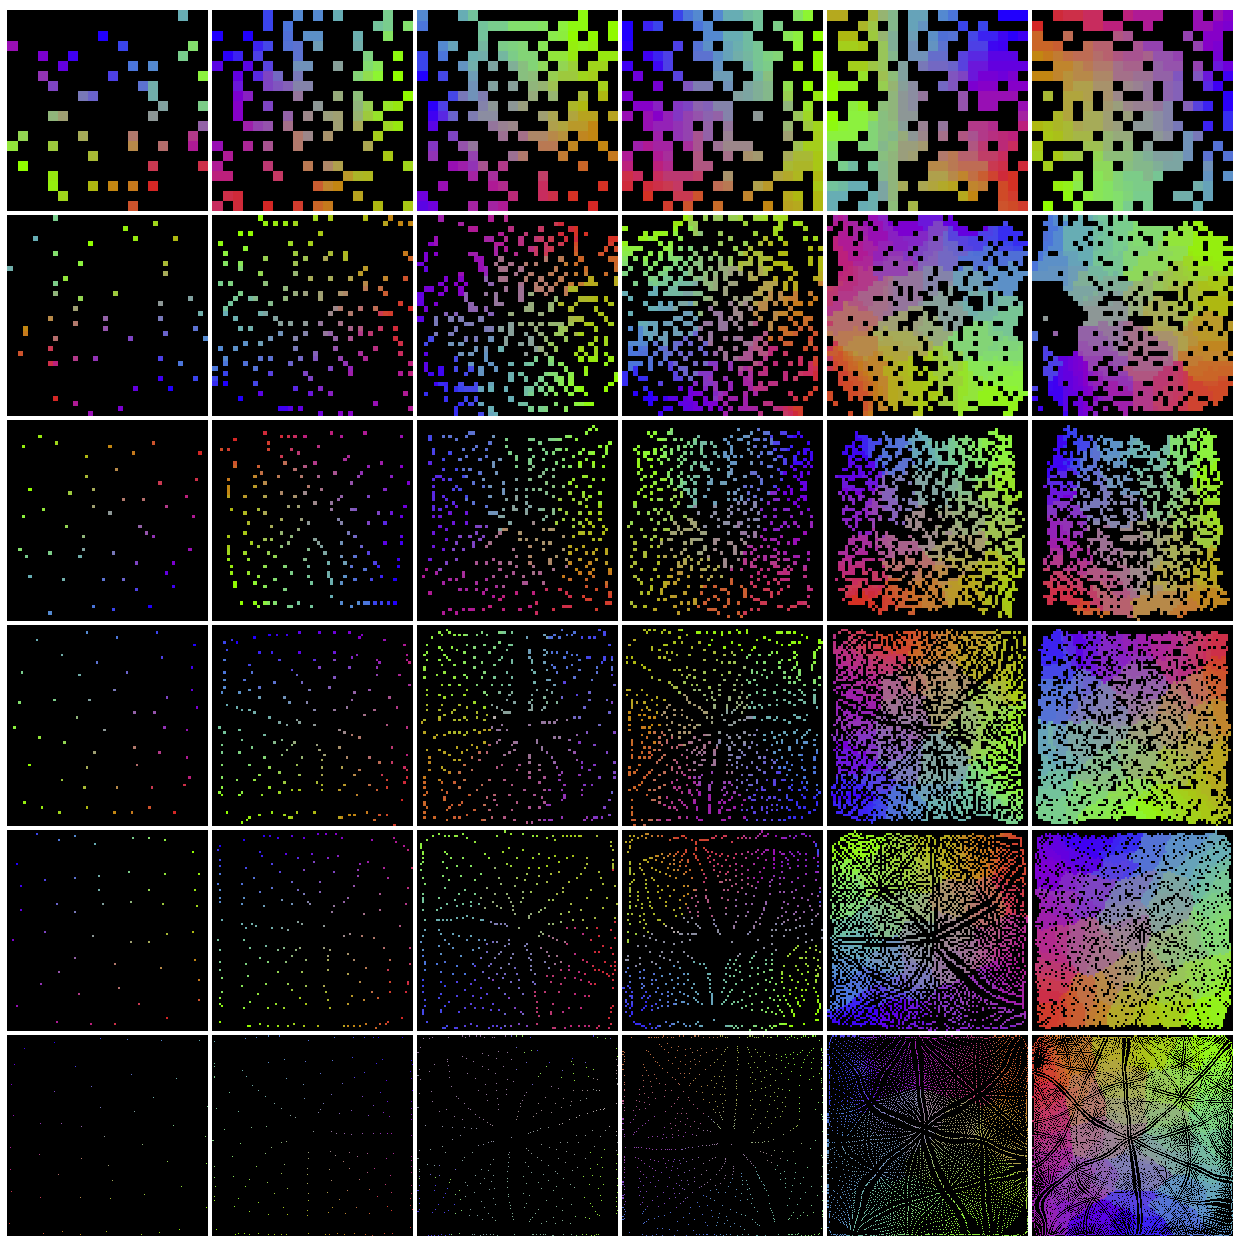
In the SOMs shown below, the number of training samples increases in
horizontal direction (![]() ,
, ![]() ,
, ![]() ,
, ![]() ,
,
![]() ,
, ![]() ), while the size of the SOM increases in
vertical direction (
), while the size of the SOM increases in
vertical direction (![]() ,
, ![]() ,
, ![]() ,
, ![]() ,
,
![]() ,
, ![]() ).
).
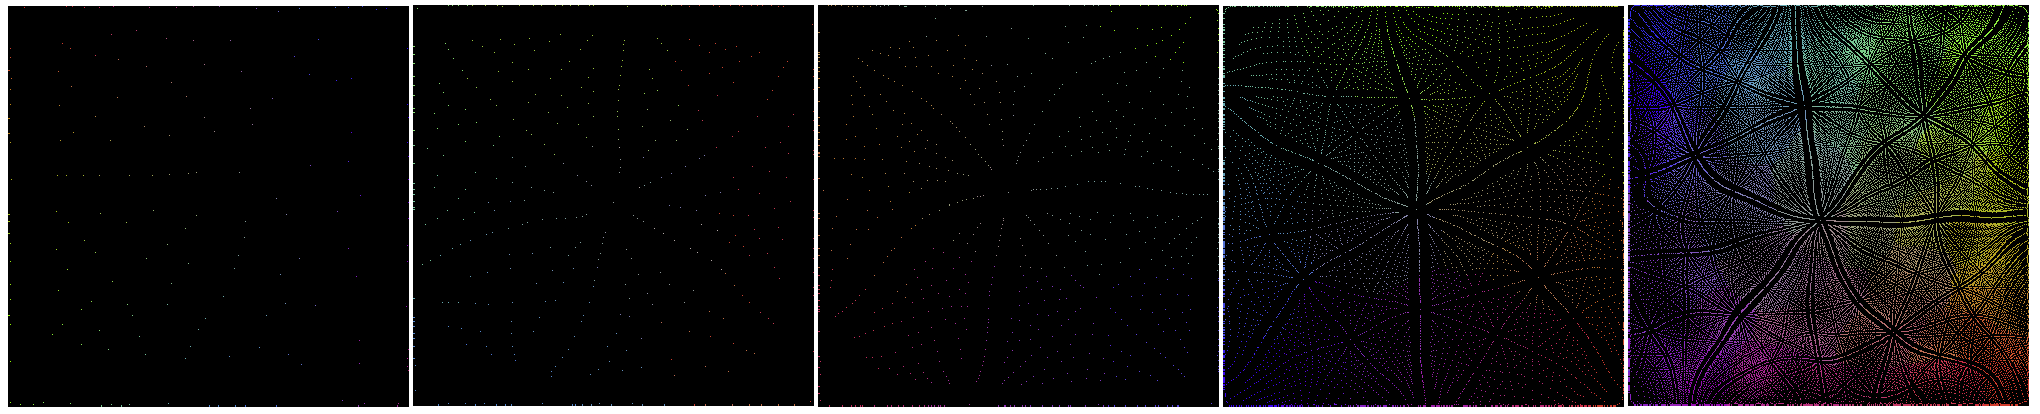
The SOMs in the figure below all have the same size of ![]() , while the
number of color vectors increase in horizontal direction (
, while the
number of color vectors increase in horizontal direction (![]() ,
, ![]() ,
,
![]() ,
, ![]() ,
, ![]() ). The Gaussian width
). The Gaussian width ![]() is 1/3 of
the size of the SOM.
is 1/3 of
the size of the SOM.
The SOMs in the figure below are similar to the previous ones except the SOMs
have the same size of ![]() .
.
The four images below are obtained after 18, 19, 20, and 21 training iterations, respectively, show how the patterns start to emerge from random distributions of the nodes responding to the training samples. More examples can be found here.
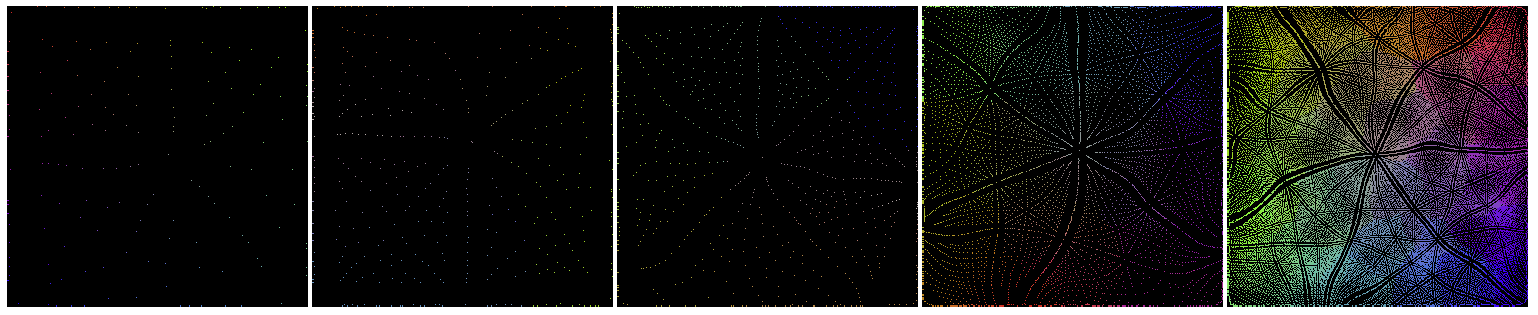
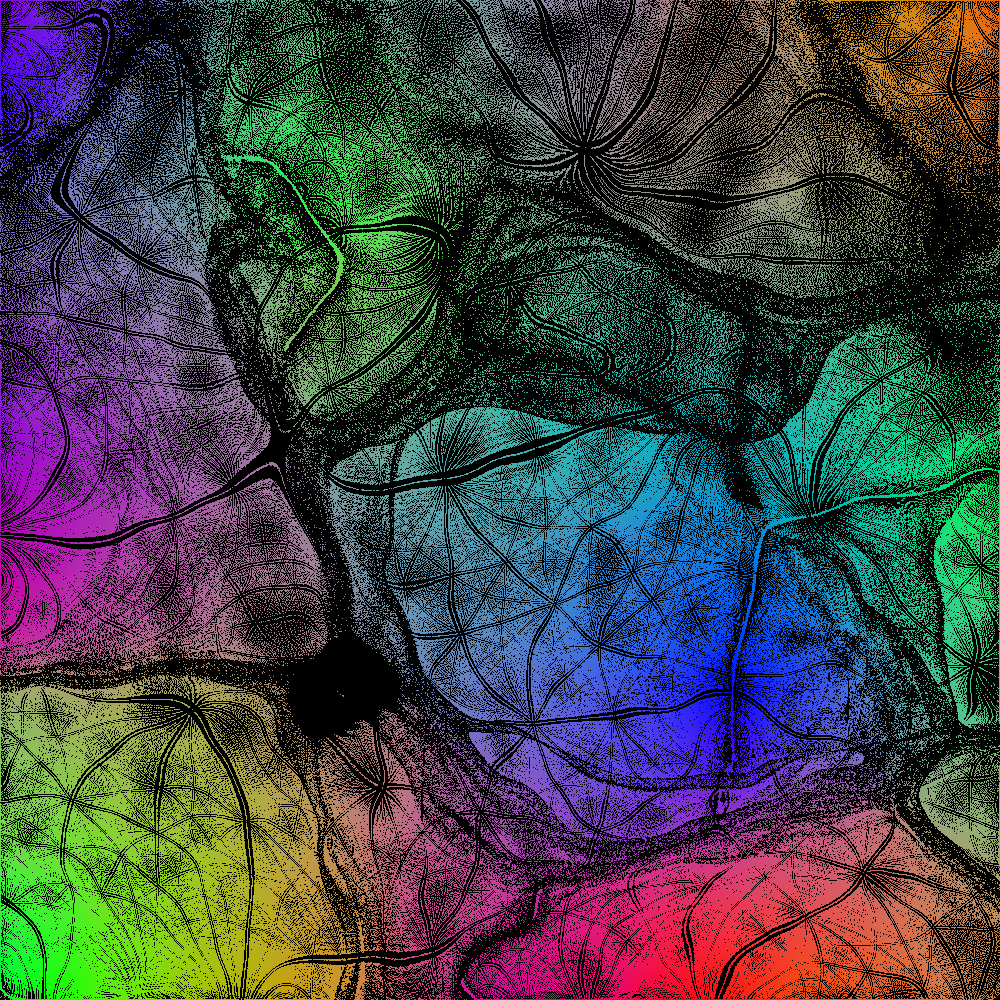
The figures below show the SOMs of size ![]() trained by
trained by ![]() samples. Here a smaller Gaussian width
samples. Here a smaller Gaussian width ![]() (1/12 of the SOM size for the first
two, 1/10 for the third) is used, consequently the resulting SOMs are less continuous
and homogeneous in comparison to the SOMs trained with greater
(1/12 of the SOM size for the first
two, 1/10 for the third) is used, consequently the resulting SOMs are less continuous
and homogeneous in comparison to the SOMs trained with greater ![]() . The first
and last SOMs are trained by 3000 iterations, while the middle one by 4000.
. The first
and last SOMs are trained by 3000 iterations, while the middle one by 4000.
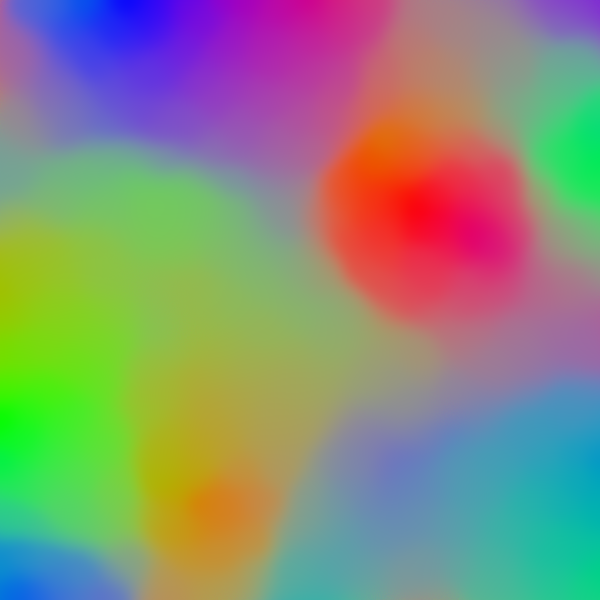
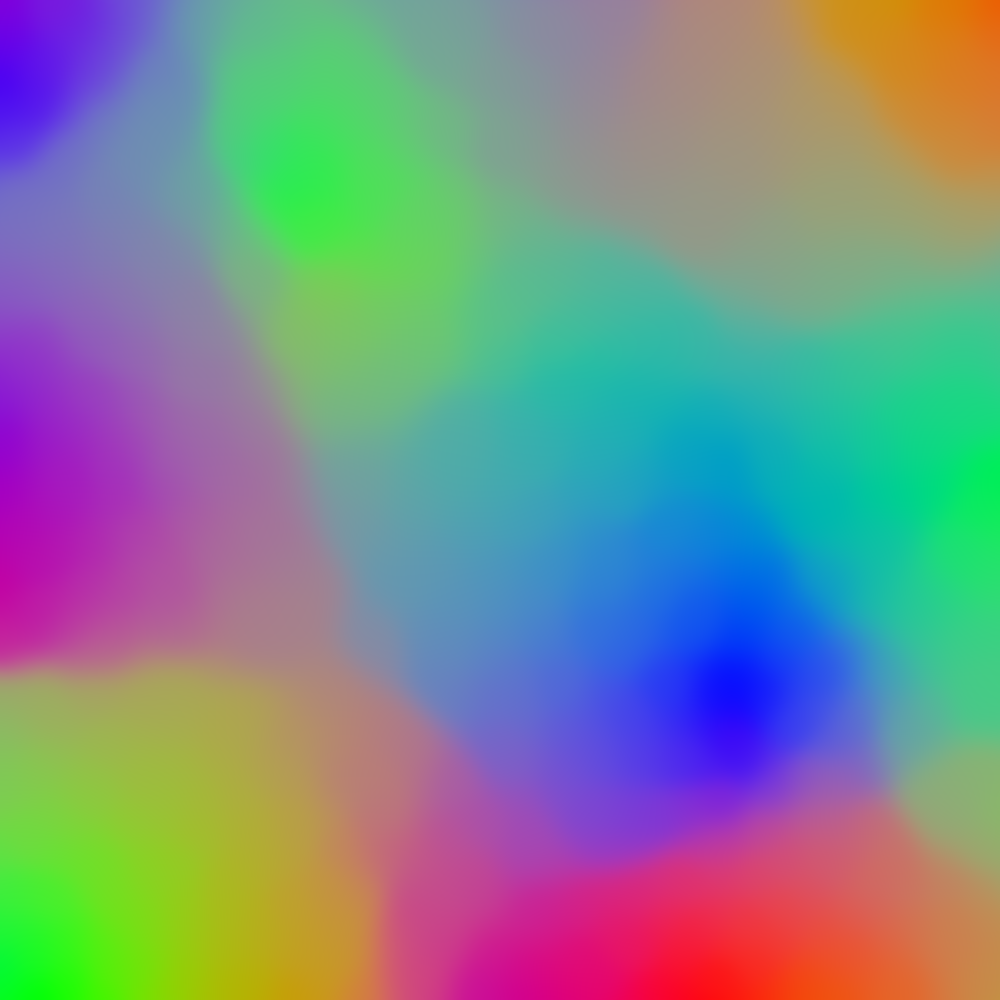
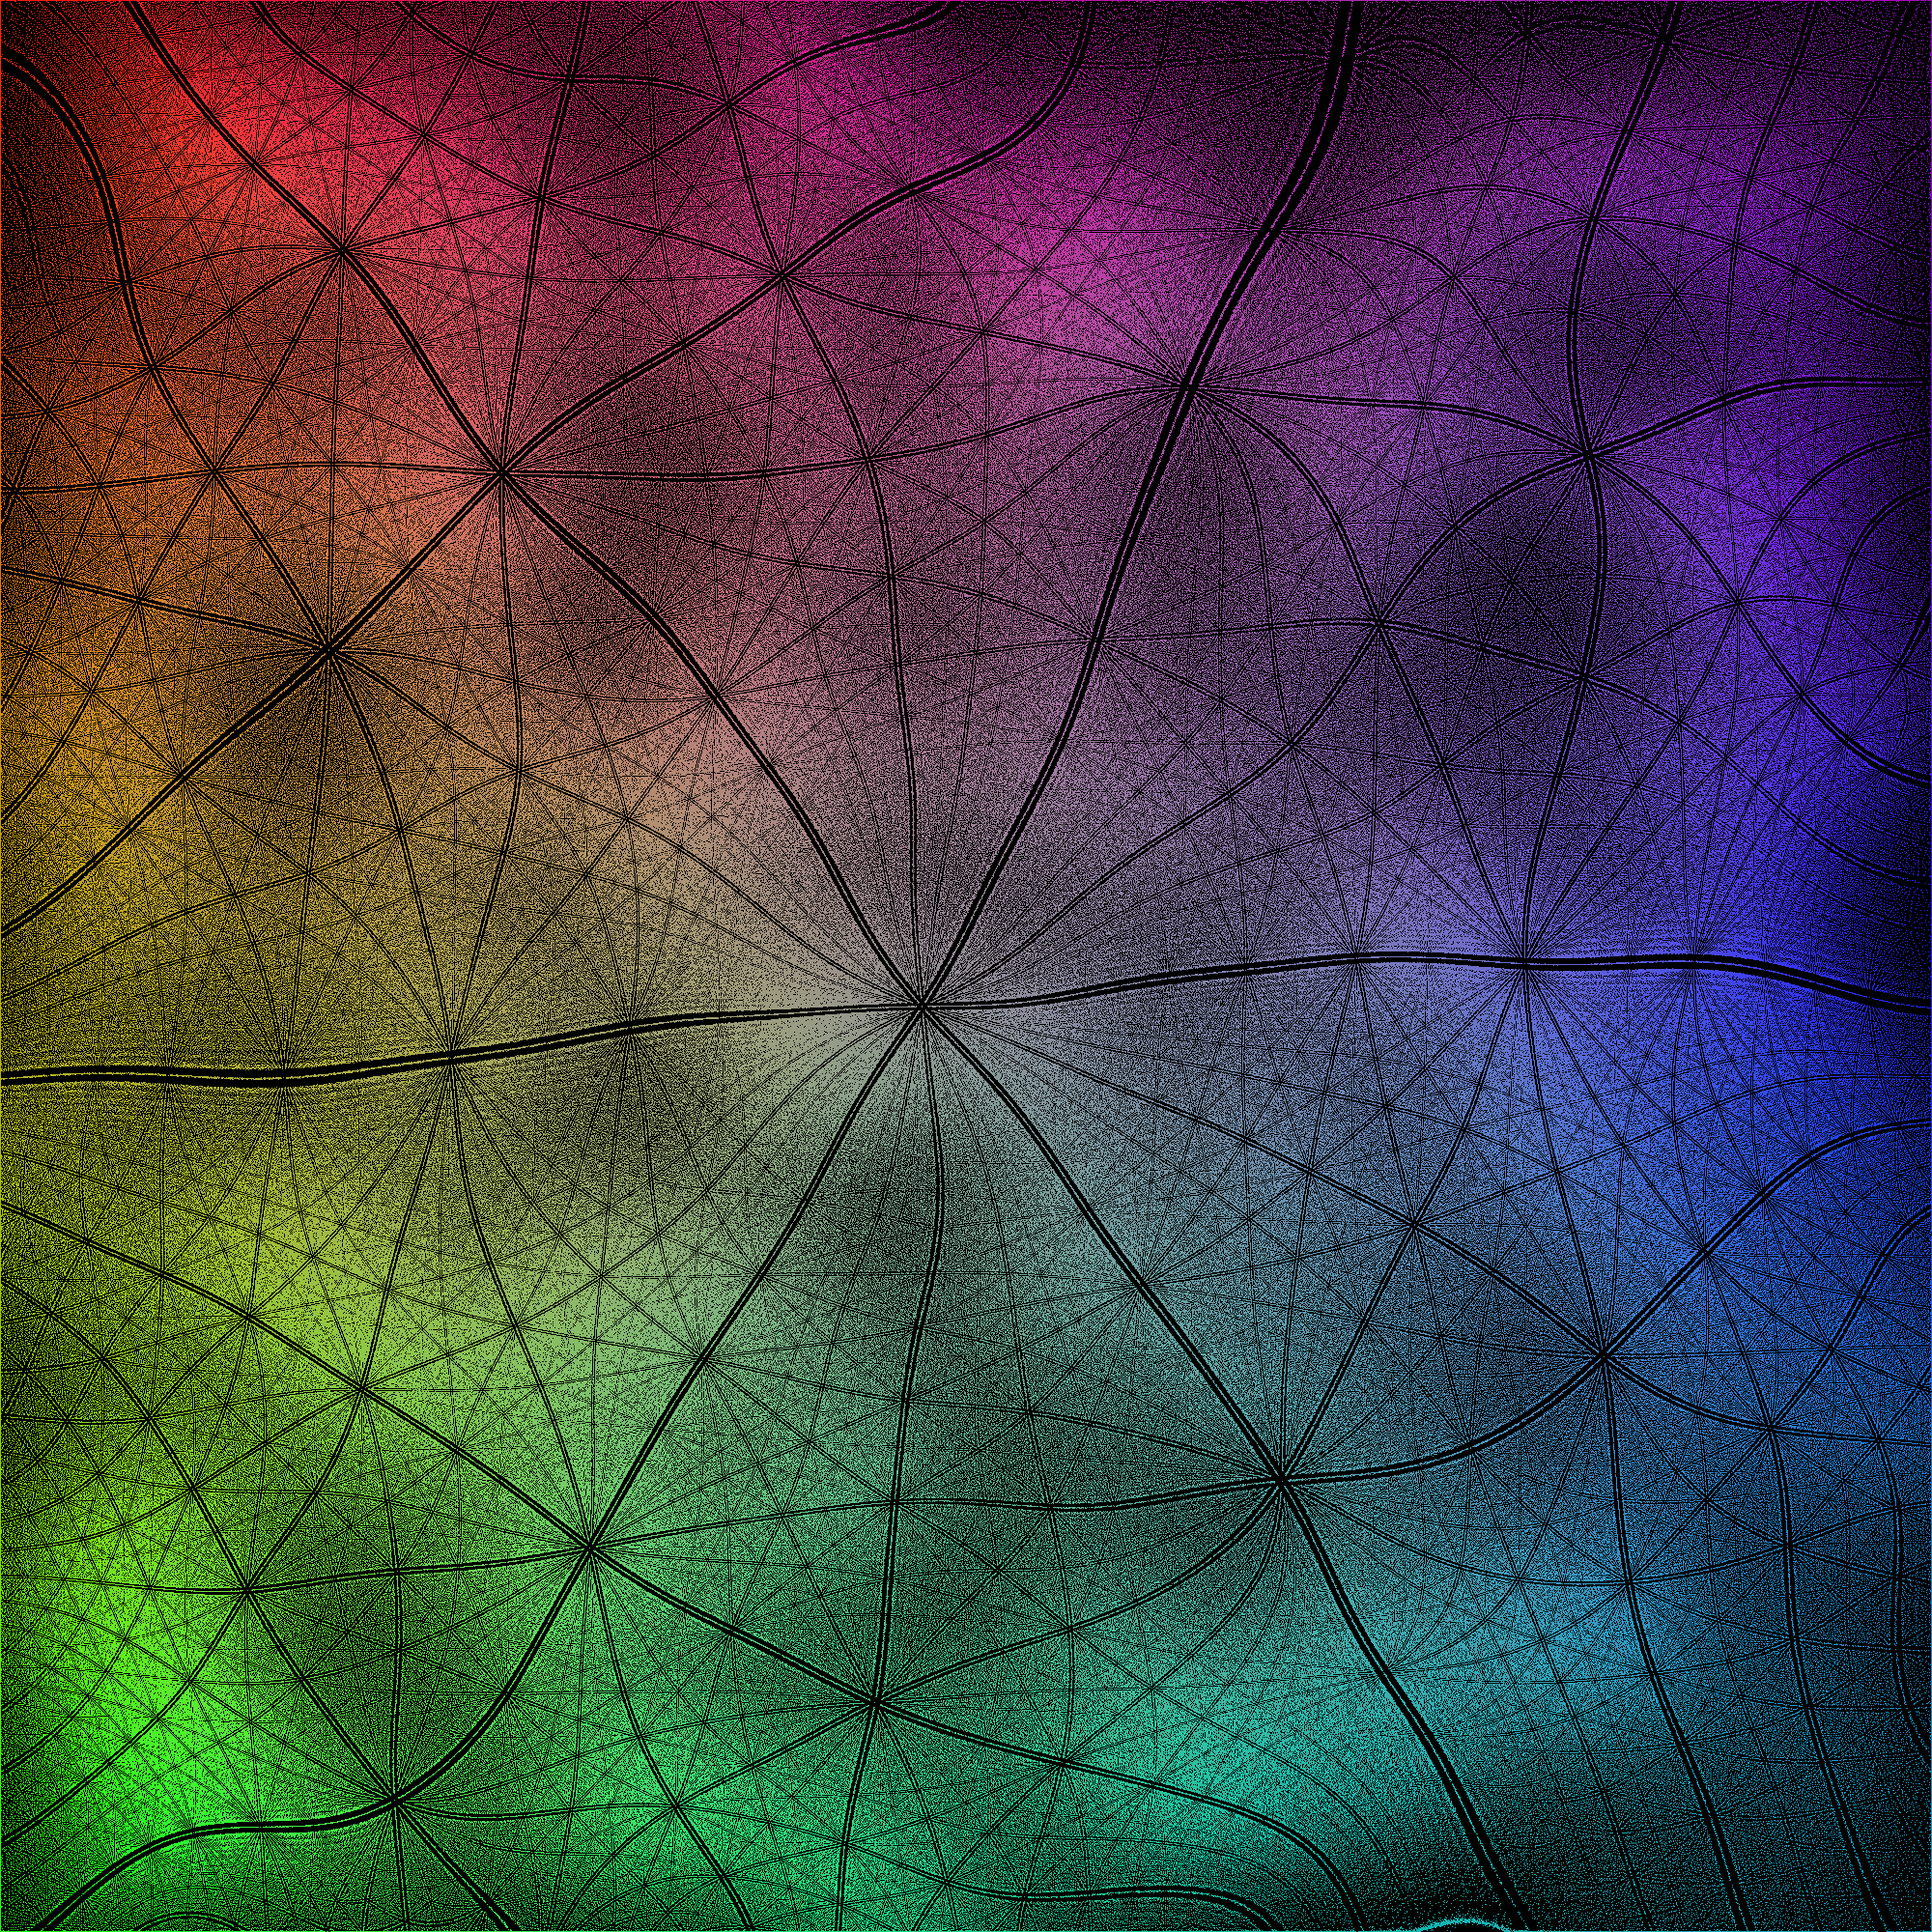
The image below is the SOM of size
![]() , trained by
, trained by
![]() color vectors, with
color vectors, with ![]() equal to 1/3 of the size.
equal to 1/3 of the size.
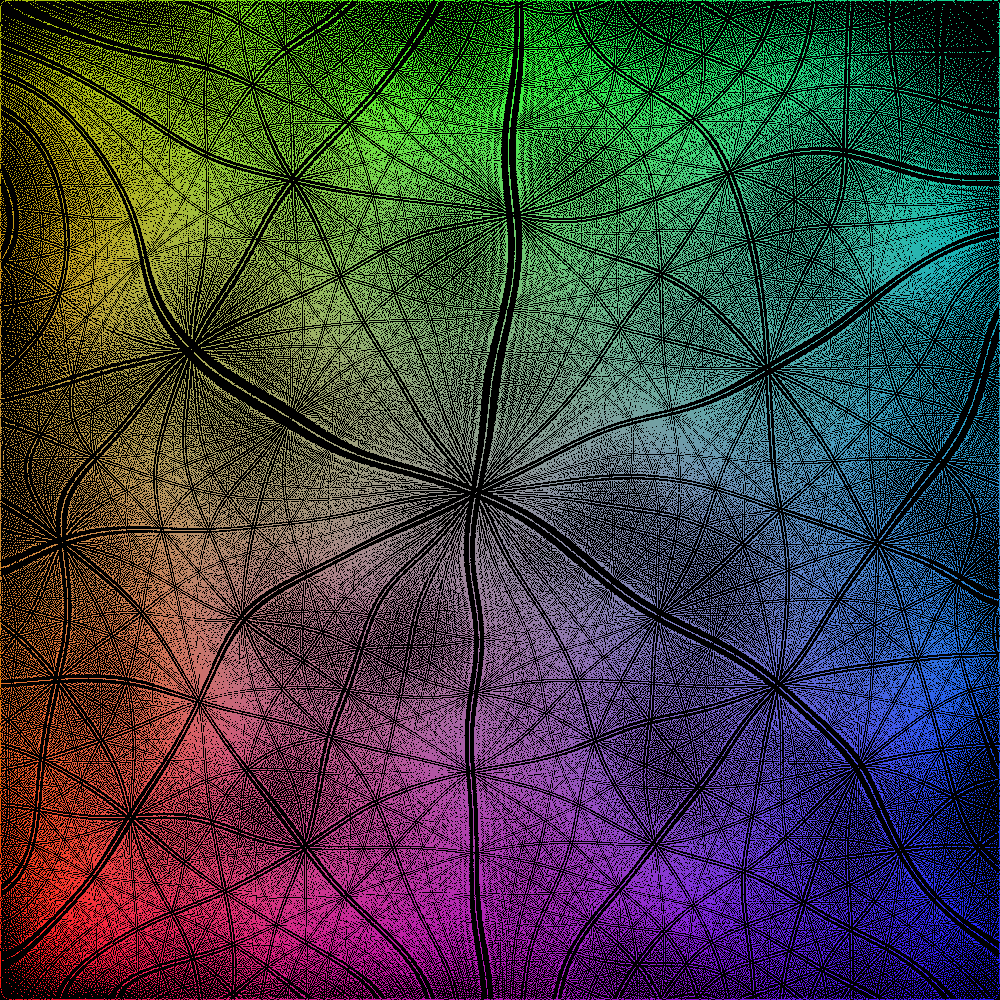
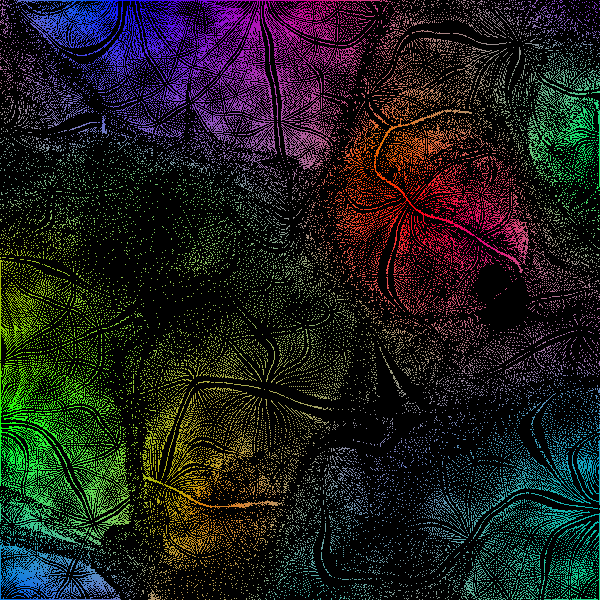
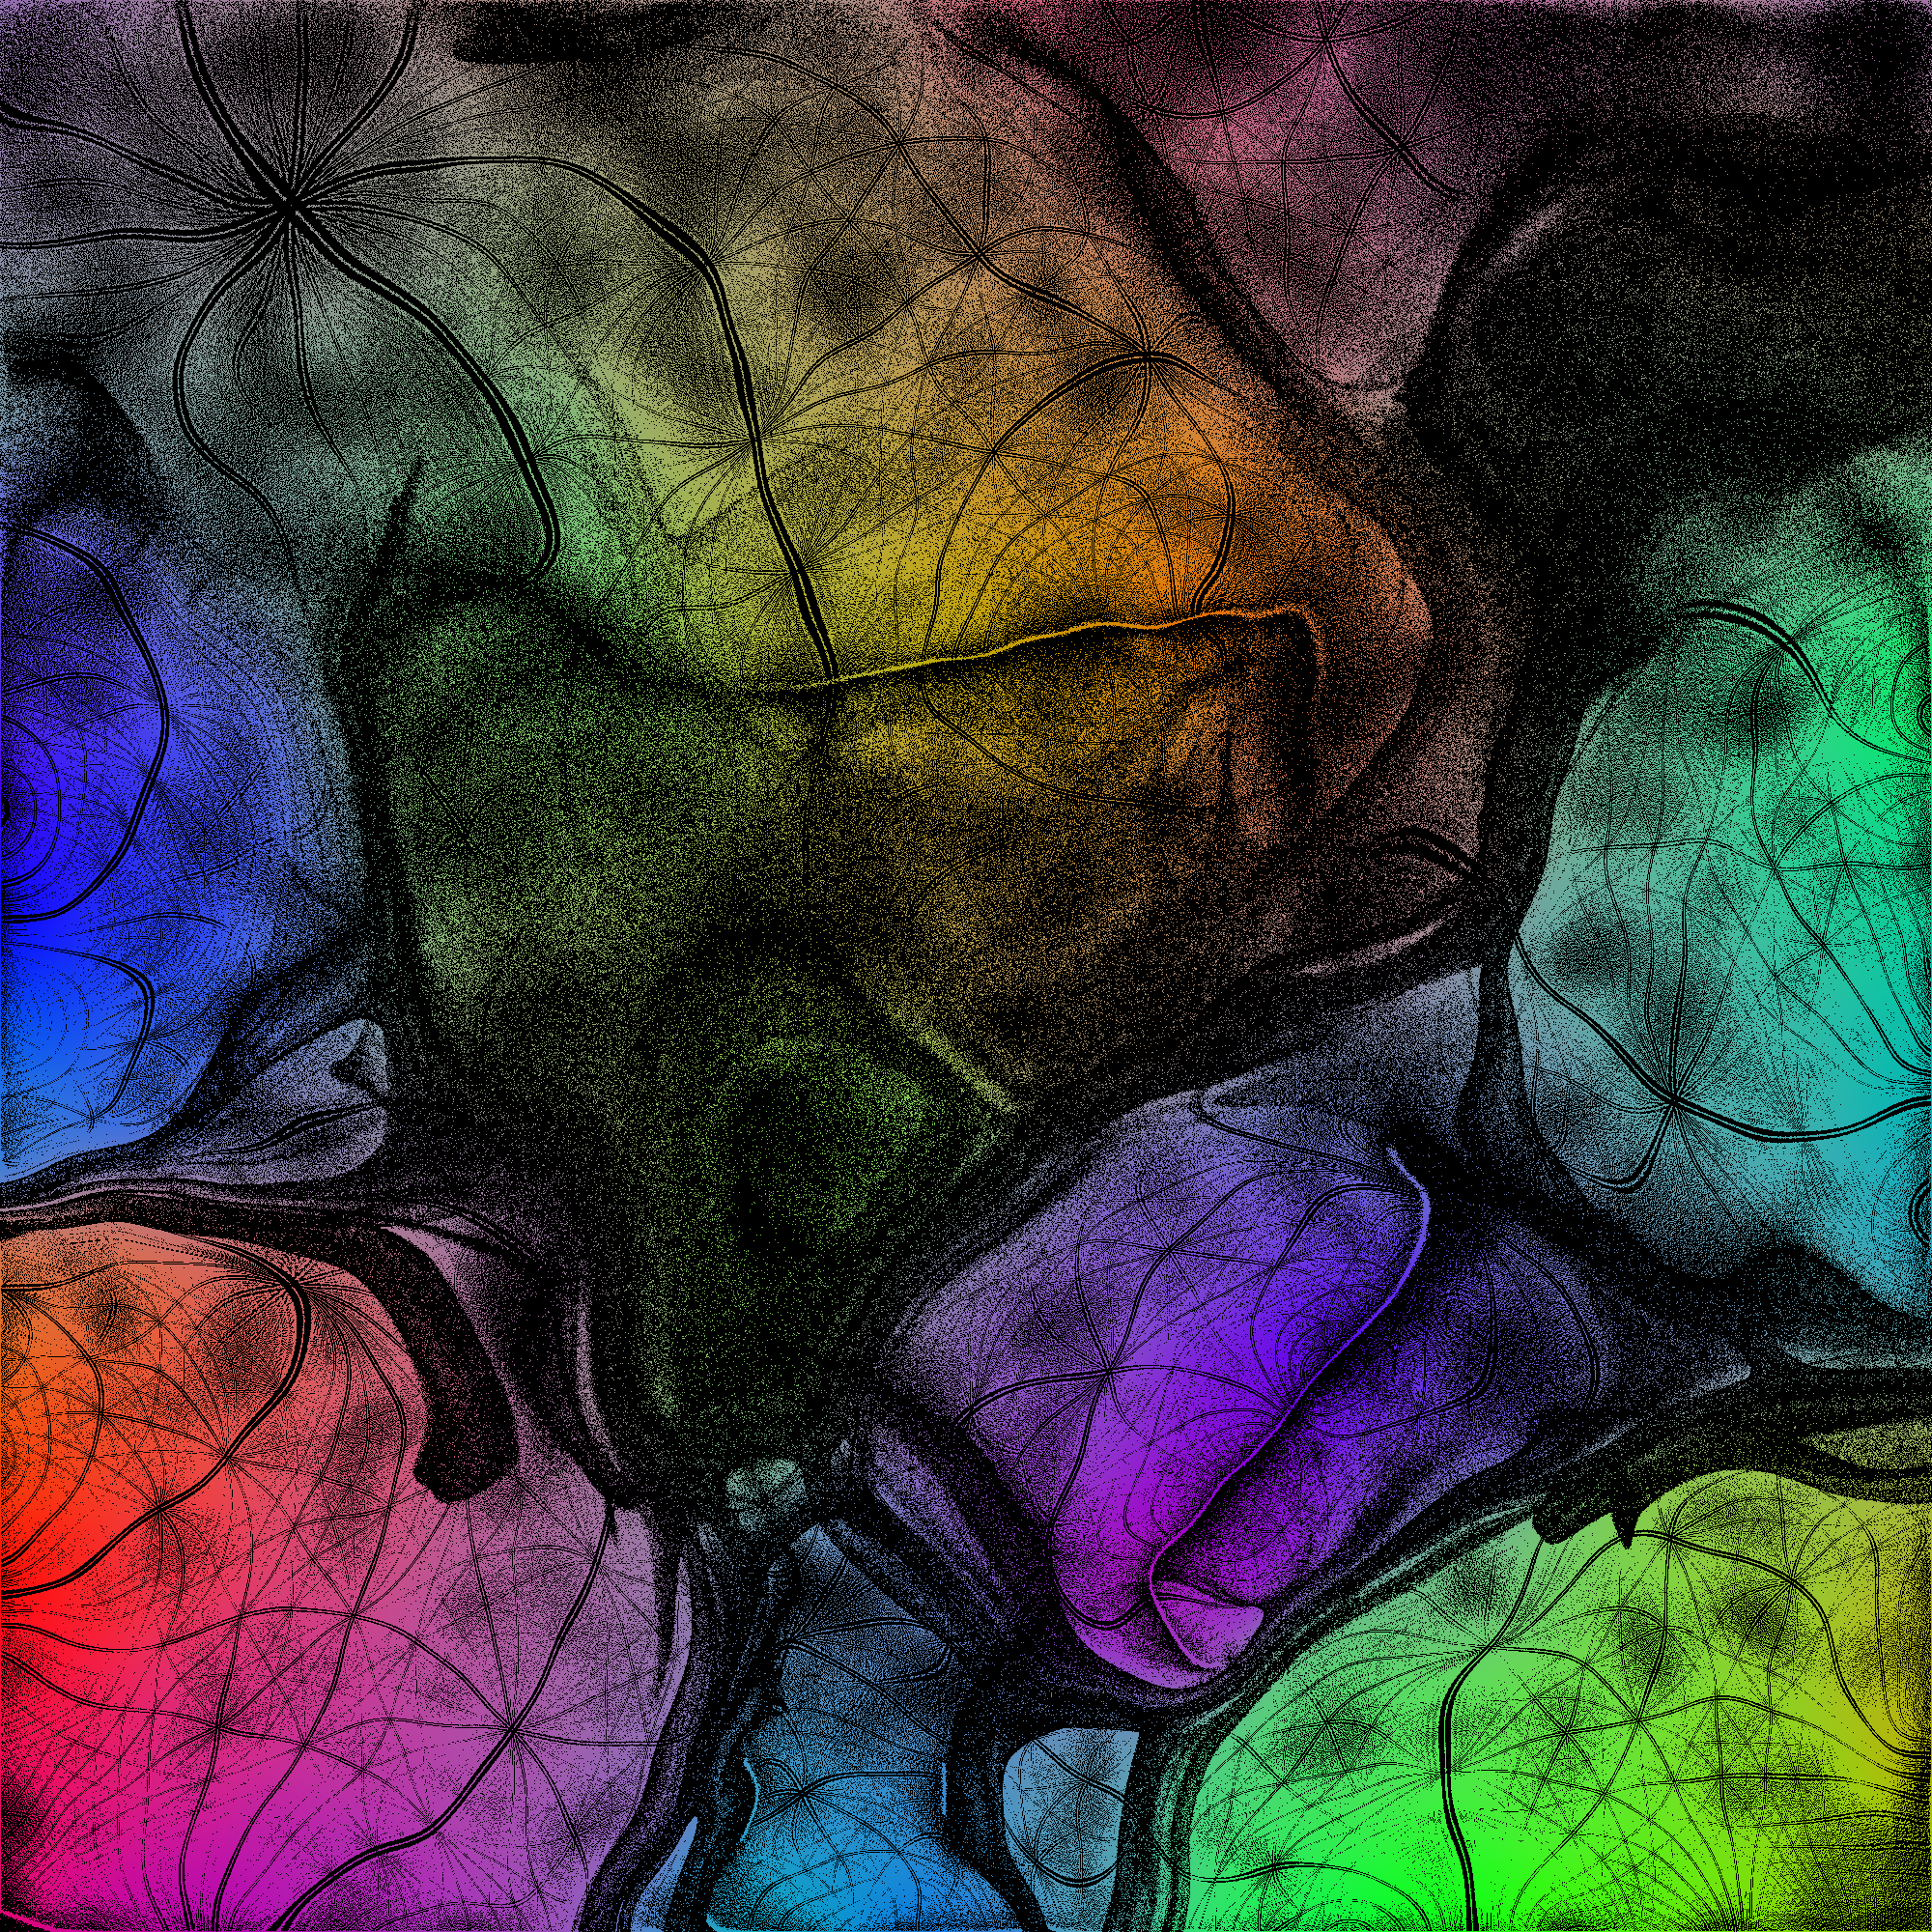
The image below is the same as before, with the only difference that here ![]() is reduced from 1/3 to 1/12 of the size of the SOM.
is reduced from 1/3 to 1/12 of the size of the SOM.
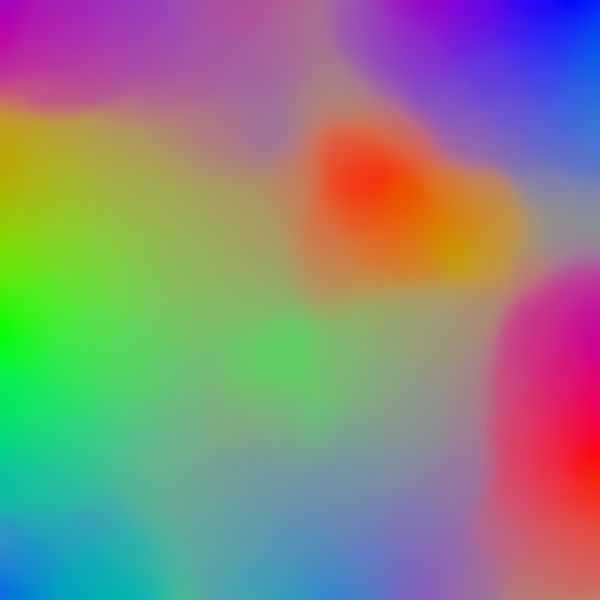
Below is a SOM of
![]() (
(![]() and
and ![]() of image size).
of image size).
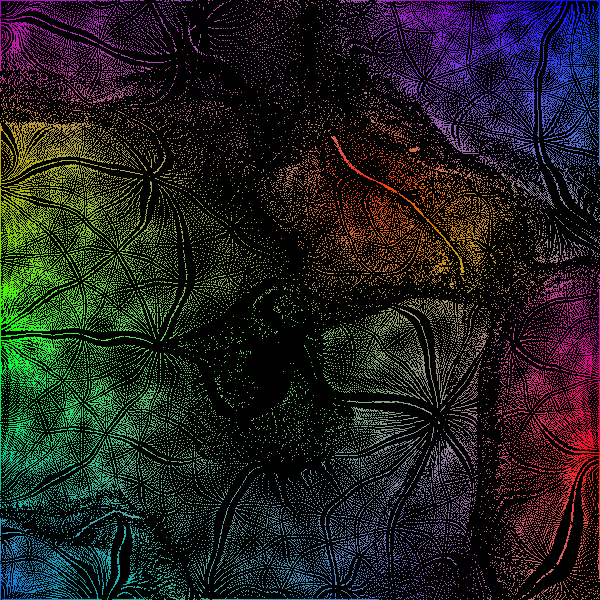
The figure below is the 2-D SOM trained by a set of 4-D vector samples. Although there seem to be some patterns in the image, they are not as obvious as those in the SOMs trained by 3-D vector samples.
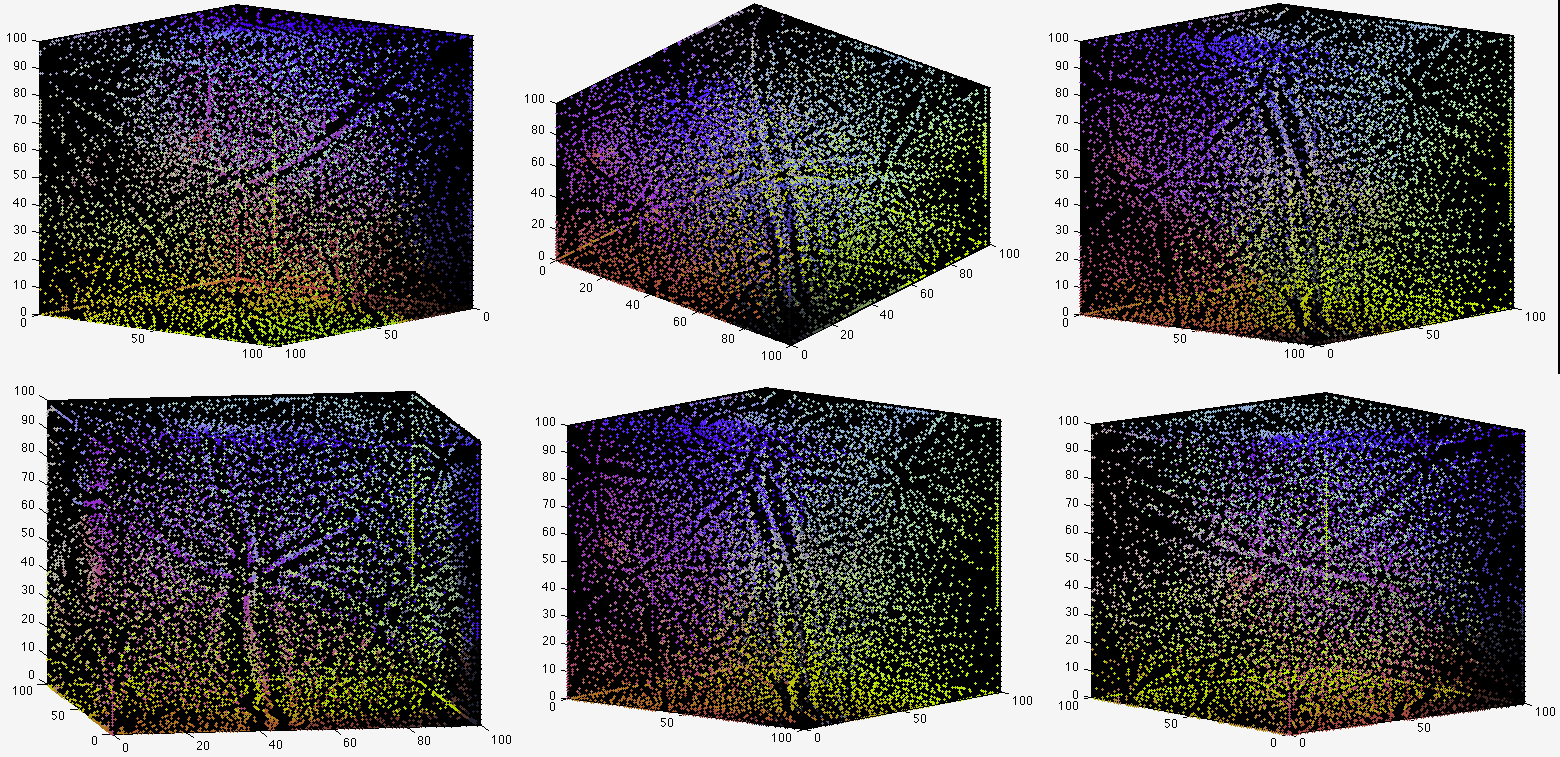
This figure below shows the 3-D SOM trained by a set of 4-D vector samples. There are some obvious patterns in the SOM, very similar to those in a 2-D SOM.